Cree vs American 11th Grade
COMPARE
Cree
American
11th Grade
11th Grade Comparison
Cree
Americans
92.9%
11TH GRADE
85.9/ 100
METRIC RATING
136th/ 347
METRIC RANK
92.7%
11TH GRADE
71.7/ 100
METRIC RATING
159th/ 347
METRIC RANK
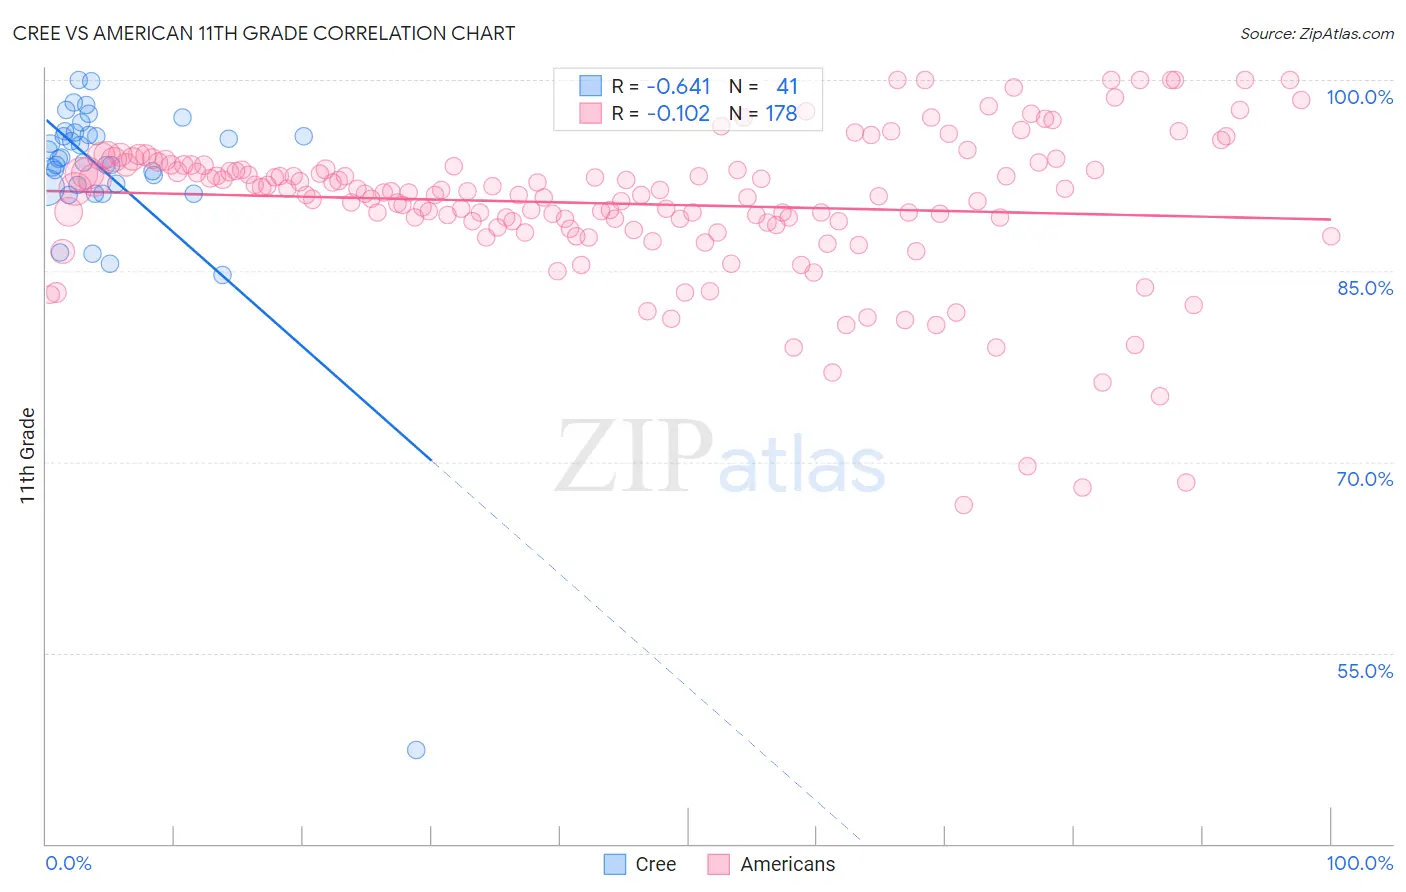
Cree vs American 11th Grade Correlation Chart
The statistical analysis conducted on geographies consisting of 76,211,744 people shows a significant negative correlation between the proportion of Cree and percentage of population with at least 11th grade education in the United States with a correlation coefficient (R) of -0.641 and weighted average of 92.9%. Similarly, the statistical analysis conducted on geographies consisting of 581,994,413 people shows a poor negative correlation between the proportion of Americans and percentage of population with at least 11th grade education in the United States with a correlation coefficient (R) of -0.102 and weighted average of 92.7%, a difference of 0.22%.
11th Grade Correlation Summary
| Measurement | Cree | American |
| Minimum | 47.4% | 66.6% |
| Maximum | 100.0% | 100.0% |
| Range | 52.6% | 33.4% |
| Mean | 92.6% | 90.3% |
| Median | 93.8% | 91.2% |
| Interquartile 25% (IQ1) | 91.6% | 88.8% |
| Interquartile 75% (IQ3) | 95.8% | 93.3% |
| Interquartile Range (IQR) | 4.2% | 4.5% |
| Standard Deviation (Sample) | 8.1% | 5.9% |
| Standard Deviation (Population) | 8.0% | 5.9% |
Similar Demographics by 11th Grade
Demographics Similar to Cree by 11th Grade
In terms of 11th grade, the demographic groups most similar to Cree are Immigrants from Italy (92.9%, a difference of 0.010%), Arab (92.9%, a difference of 0.010%), Immigrants from Brazil (92.9%, a difference of 0.020%), Mongolian (93.0%, a difference of 0.030%), and Delaware (93.0%, a difference of 0.030%).
| Demographics | Rating | Rank | 11th Grade |
| Immigrants | Ukraine | 89.8 /100 | #129 | Excellent 93.0% |
| Albanians | 89.5 /100 | #130 | Excellent 93.0% |
| Egyptians | 89.5 /100 | #131 | Excellent 93.0% |
| Immigrants | Bosnia and Herzegovina | 89.0 /100 | #132 | Excellent 93.0% |
| Mongolians | 87.6 /100 | #133 | Excellent 93.0% |
| Delaware | 87.3 /100 | #134 | Excellent 93.0% |
| Immigrants | Italy | 86.6 /100 | #135 | Excellent 92.9% |
| Cree | 85.9 /100 | #136 | Excellent 92.9% |
| Arabs | 85.4 /100 | #137 | Excellent 92.9% |
| Immigrants | Brazil | 85.1 /100 | #138 | Excellent 92.9% |
| Crow | 84.1 /100 | #139 | Excellent 92.9% |
| Venezuelans | 83.4 /100 | #140 | Excellent 92.9% |
| Chileans | 83.0 /100 | #141 | Excellent 92.9% |
| Kenyans | 82.0 /100 | #142 | Excellent 92.9% |
| Ugandans | 81.4 /100 | #143 | Excellent 92.9% |
Demographics Similar to Americans by 11th Grade
In terms of 11th grade, the demographic groups most similar to Americans are Immigrants from Venezuela (92.7%, a difference of 0.0%), Immigrants from Eastern Asia (92.7%, a difference of 0.010%), Immigrants from Lebanon (92.7%, a difference of 0.010%), Osage (92.7%, a difference of 0.020%), and Argentinean (92.7%, a difference of 0.020%).
| Demographics | Rating | Rank | 11th Grade |
| Iraqis | 74.2 /100 | #152 | Good 92.8% |
| Brazilians | 73.9 /100 | #153 | Good 92.8% |
| Osage | 73.4 /100 | #154 | Good 92.7% |
| Argentineans | 73.4 /100 | #155 | Good 92.7% |
| Immigrants | Spain | 73.0 /100 | #156 | Good 92.7% |
| Immigrants | Eastern Asia | 72.6 /100 | #157 | Good 92.7% |
| Immigrants | Venezuela | 72.0 /100 | #158 | Good 92.7% |
| Americans | 71.7 /100 | #159 | Good 92.7% |
| Immigrants | Lebanon | 70.7 /100 | #160 | Good 92.7% |
| Immigrants | Argentina | 69.8 /100 | #161 | Good 92.7% |
| Paraguayans | 68.7 /100 | #162 | Good 92.7% |
| Immigrants | Nonimmigrants | 66.6 /100 | #163 | Good 92.7% |
| Spanish | 66.2 /100 | #164 | Good 92.7% |
| Immigrants | Iraq | 63.7 /100 | #165 | Good 92.6% |
| Bermudans | 62.3 /100 | #166 | Good 92.6% |