Cree vs Cheyenne 11th Grade
COMPARE
Cree
Cheyenne
11th Grade
11th Grade Comparison
Cree
Cheyenne
92.9%
11TH GRADE
85.9/ 100
METRIC RATING
136th/ 347
METRIC RANK
91.8%
11TH GRADE
3.3/ 100
METRIC RATING
233rd/ 347
METRIC RANK
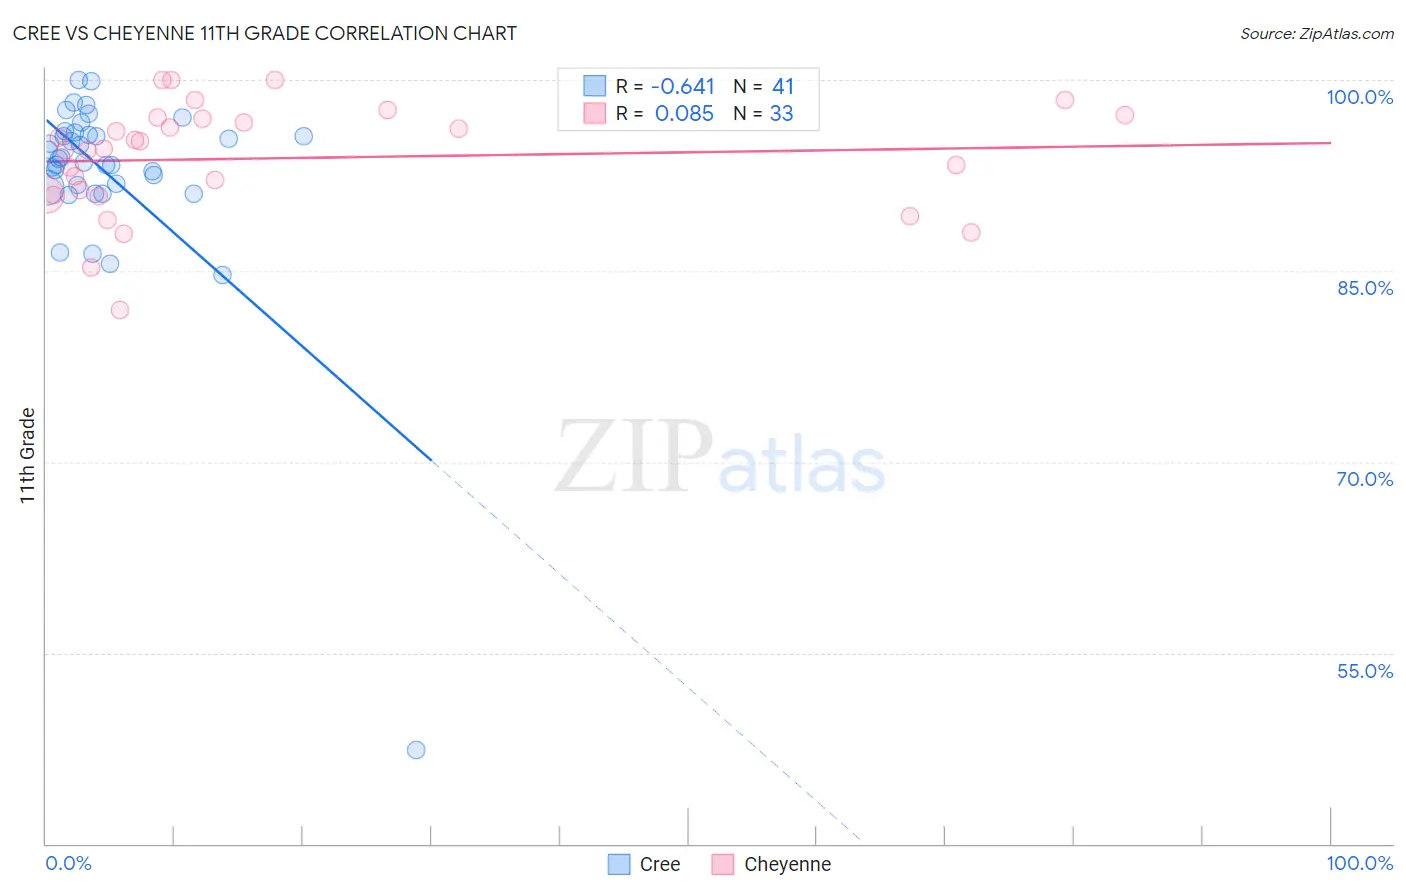
Cree vs Cheyenne 11th Grade Correlation Chart
The statistical analysis conducted on geographies consisting of 76,211,744 people shows a significant negative correlation between the proportion of Cree and percentage of population with at least 11th grade education in the United States with a correlation coefficient (R) of -0.641 and weighted average of 92.9%. Similarly, the statistical analysis conducted on geographies consisting of 80,719,287 people shows a slight positive correlation between the proportion of Cheyenne and percentage of population with at least 11th grade education in the United States with a correlation coefficient (R) of 0.085 and weighted average of 91.8%, a difference of 1.3%.
11th Grade Correlation Summary
| Measurement | Cree | Cheyenne |
| Minimum | 47.4% | 81.9% |
| Maximum | 100.0% | 100.0% |
| Range | 52.6% | 18.1% |
| Mean | 92.6% | 93.9% |
| Median | 93.8% | 94.6% |
| Interquartile 25% (IQ1) | 91.6% | 91.0% |
| Interquartile 75% (IQ3) | 95.8% | 97.0% |
| Interquartile Range (IQR) | 4.2% | 6.0% |
| Standard Deviation (Sample) | 8.1% | 4.3% |
| Standard Deviation (Population) | 8.0% | 4.3% |
Similar Demographics by 11th Grade
Demographics Similar to Cree by 11th Grade
In terms of 11th grade, the demographic groups most similar to Cree are Immigrants from Italy (92.9%, a difference of 0.010%), Arab (92.9%, a difference of 0.010%), Immigrants from Brazil (92.9%, a difference of 0.020%), Mongolian (93.0%, a difference of 0.030%), and Delaware (93.0%, a difference of 0.030%).
| Demographics | Rating | Rank | 11th Grade |
| Immigrants | Ukraine | 89.8 /100 | #129 | Excellent 93.0% |
| Albanians | 89.5 /100 | #130 | Excellent 93.0% |
| Egyptians | 89.5 /100 | #131 | Excellent 93.0% |
| Immigrants | Bosnia and Herzegovina | 89.0 /100 | #132 | Excellent 93.0% |
| Mongolians | 87.6 /100 | #133 | Excellent 93.0% |
| Delaware | 87.3 /100 | #134 | Excellent 93.0% |
| Immigrants | Italy | 86.6 /100 | #135 | Excellent 92.9% |
| Cree | 85.9 /100 | #136 | Excellent 92.9% |
| Arabs | 85.4 /100 | #137 | Excellent 92.9% |
| Immigrants | Brazil | 85.1 /100 | #138 | Excellent 92.9% |
| Crow | 84.1 /100 | #139 | Excellent 92.9% |
| Venezuelans | 83.4 /100 | #140 | Excellent 92.9% |
| Chileans | 83.0 /100 | #141 | Excellent 92.9% |
| Kenyans | 82.0 /100 | #142 | Excellent 92.9% |
| Ugandans | 81.4 /100 | #143 | Excellent 92.9% |
Demographics Similar to Cheyenne by 11th Grade
In terms of 11th grade, the demographic groups most similar to Cheyenne are Uruguayan (91.8%, a difference of 0.010%), Choctaw (91.8%, a difference of 0.030%), Armenian (91.7%, a difference of 0.030%), Subsaharan African (91.7%, a difference of 0.030%), and Immigrants from Afghanistan (91.8%, a difference of 0.040%).
| Demographics | Rating | Rank | 11th Grade |
| Immigrants | Somalia | 5.2 /100 | #226 | Tragic 91.9% |
| Immigrants | Cameroon | 4.4 /100 | #227 | Tragic 91.8% |
| Immigrants | Panama | 4.3 /100 | #228 | Tragic 91.8% |
| Nigerians | 4.3 /100 | #229 | Tragic 91.8% |
| Immigrants | Afghanistan | 3.9 /100 | #230 | Tragic 91.8% |
| Choctaw | 3.7 /100 | #231 | Tragic 91.8% |
| Uruguayans | 3.5 /100 | #232 | Tragic 91.8% |
| Cheyenne | 3.3 /100 | #233 | Tragic 91.8% |
| Armenians | 2.9 /100 | #234 | Tragic 91.7% |
| Sub-Saharan Africans | 2.9 /100 | #235 | Tragic 91.7% |
| Colombians | 2.8 /100 | #236 | Tragic 91.7% |
| Immigrants | Bolivia | 2.8 /100 | #237 | Tragic 91.7% |
| Comanche | 2.6 /100 | #238 | Tragic 91.7% |
| Hopi | 2.5 /100 | #239 | Tragic 91.7% |
| South Americans | 2.0 /100 | #240 | Tragic 91.6% |