Cree vs Maltese 11th Grade
COMPARE
Cree
Maltese
11th Grade
11th Grade Comparison
Cree
Maltese
92.9%
11TH GRADE
85.9/ 100
METRIC RATING
136th/ 347
METRIC RANK
94.5%
11TH GRADE
100.0/ 100
METRIC RATING
18th/ 347
METRIC RANK
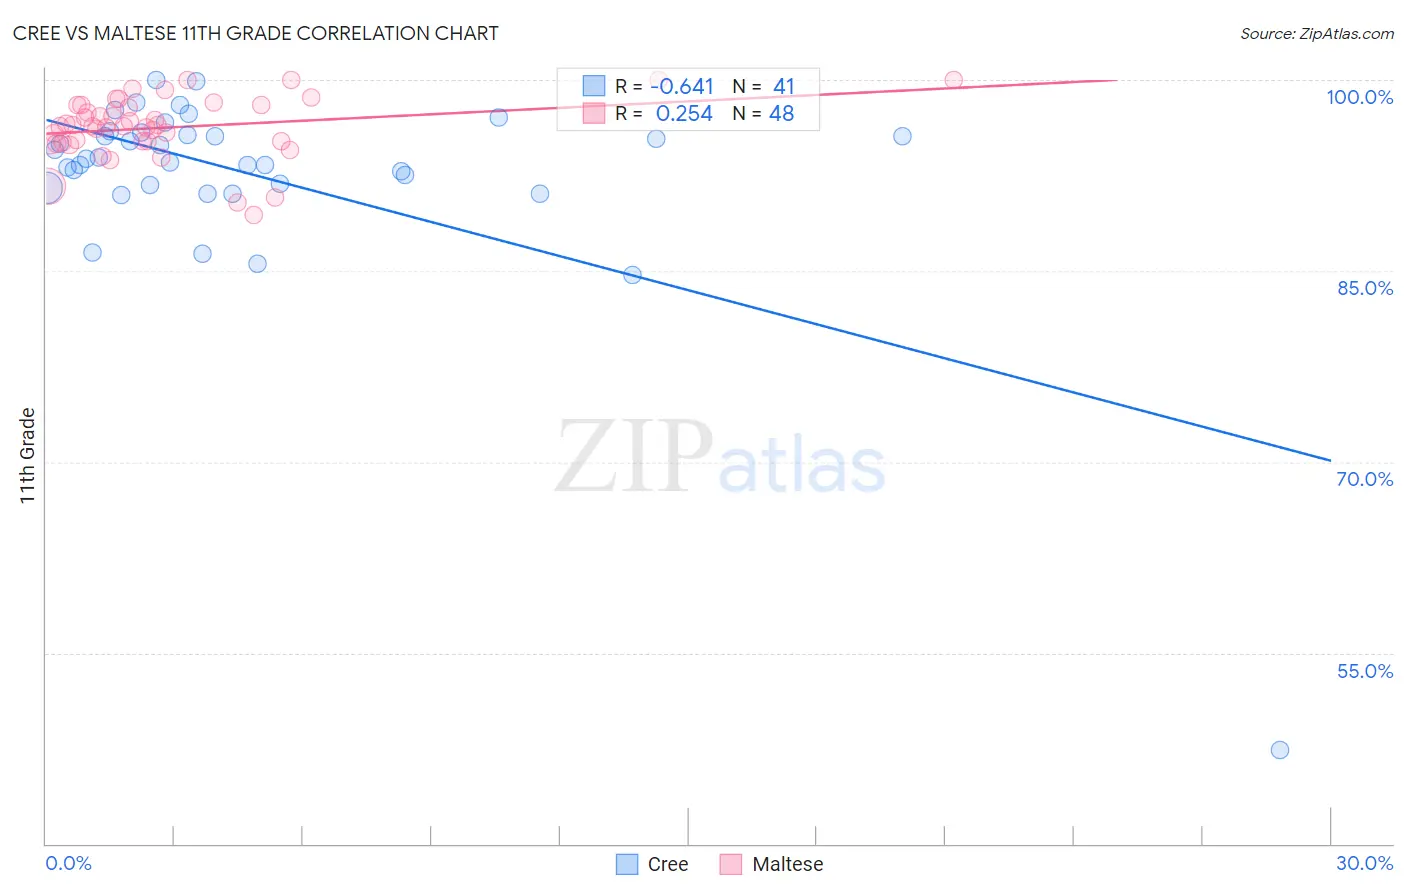
Cree vs Maltese 11th Grade Correlation Chart
The statistical analysis conducted on geographies consisting of 76,211,744 people shows a significant negative correlation between the proportion of Cree and percentage of population with at least 11th grade education in the United States with a correlation coefficient (R) of -0.641 and weighted average of 92.9%. Similarly, the statistical analysis conducted on geographies consisting of 126,478,070 people shows a weak positive correlation between the proportion of Maltese and percentage of population with at least 11th grade education in the United States with a correlation coefficient (R) of 0.254 and weighted average of 94.5%, a difference of 1.7%.
11th Grade Correlation Summary
| Measurement | Cree | Maltese |
| Minimum | 47.4% | 89.4% |
| Maximum | 100.0% | 100.0% |
| Range | 52.6% | 10.6% |
| Mean | 92.6% | 96.3% |
| Median | 93.8% | 96.4% |
| Interquartile 25% (IQ1) | 91.6% | 95.1% |
| Interquartile 75% (IQ3) | 95.8% | 98.0% |
| Interquartile Range (IQR) | 4.2% | 2.9% |
| Standard Deviation (Sample) | 8.1% | 2.4% |
| Standard Deviation (Population) | 8.0% | 2.4% |
Similar Demographics by 11th Grade
Demographics Similar to Cree by 11th Grade
In terms of 11th grade, the demographic groups most similar to Cree are Immigrants from Italy (92.9%, a difference of 0.010%), Arab (92.9%, a difference of 0.010%), Immigrants from Brazil (92.9%, a difference of 0.020%), Mongolian (93.0%, a difference of 0.030%), and Delaware (93.0%, a difference of 0.030%).
| Demographics | Rating | Rank | 11th Grade |
| Immigrants | Ukraine | 89.8 /100 | #129 | Excellent 93.0% |
| Albanians | 89.5 /100 | #130 | Excellent 93.0% |
| Egyptians | 89.5 /100 | #131 | Excellent 93.0% |
| Immigrants | Bosnia and Herzegovina | 89.0 /100 | #132 | Excellent 93.0% |
| Mongolians | 87.6 /100 | #133 | Excellent 93.0% |
| Delaware | 87.3 /100 | #134 | Excellent 93.0% |
| Immigrants | Italy | 86.6 /100 | #135 | Excellent 92.9% |
| Cree | 85.9 /100 | #136 | Excellent 92.9% |
| Arabs | 85.4 /100 | #137 | Excellent 92.9% |
| Immigrants | Brazil | 85.1 /100 | #138 | Excellent 92.9% |
| Crow | 84.1 /100 | #139 | Excellent 92.9% |
| Venezuelans | 83.4 /100 | #140 | Excellent 92.9% |
| Chileans | 83.0 /100 | #141 | Excellent 92.9% |
| Kenyans | 82.0 /100 | #142 | Excellent 92.9% |
| Ugandans | 81.4 /100 | #143 | Excellent 92.9% |
Demographics Similar to Maltese by 11th Grade
In terms of 11th grade, the demographic groups most similar to Maltese are Luxembourger (94.5%, a difference of 0.0%), Scandinavian (94.5%, a difference of 0.0%), Bulgarian (94.5%, a difference of 0.010%), Immigrants from India (94.5%, a difference of 0.010%), and Italian (94.5%, a difference of 0.030%).
| Demographics | Rating | Rank | 11th Grade |
| Germans | 100.0 /100 | #11 | Exceptional 94.7% |
| Latvians | 100.0 /100 | #12 | Exceptional 94.7% |
| Chinese | 100.0 /100 | #13 | Exceptional 94.6% |
| Eastern Europeans | 100.0 /100 | #14 | Exceptional 94.6% |
| Bulgarians | 100.0 /100 | #15 | Exceptional 94.5% |
| Immigrants | India | 100.0 /100 | #16 | Exceptional 94.5% |
| Luxembourgers | 100.0 /100 | #17 | Exceptional 94.5% |
| Maltese | 100.0 /100 | #18 | Exceptional 94.5% |
| Scandinavians | 100.0 /100 | #19 | Exceptional 94.5% |
| Italians | 100.0 /100 | #20 | Exceptional 94.5% |
| Tlingit-Haida | 100.0 /100 | #21 | Exceptional 94.4% |
| Tsimshian | 100.0 /100 | #22 | Exceptional 94.4% |
| Czechs | 100.0 /100 | #23 | Exceptional 94.4% |
| English | 100.0 /100 | #24 | Exceptional 94.4% |
| Irish | 100.0 /100 | #25 | Exceptional 94.4% |