Immigrants from the Azores vs Aleut Professional Degree
COMPARE
Immigrants from the Azores
Aleut
Professional Degree
Professional Degree Comparison
Immigrants from the Azores
Aleuts
2.8%
PROFESSIONAL DEGREE
0.0/ 100
METRIC RATING
342nd/ 347
METRIC RANK
3.6%
PROFESSIONAL DEGREE
0.7/ 100
METRIC RATING
268th/ 347
METRIC RANK
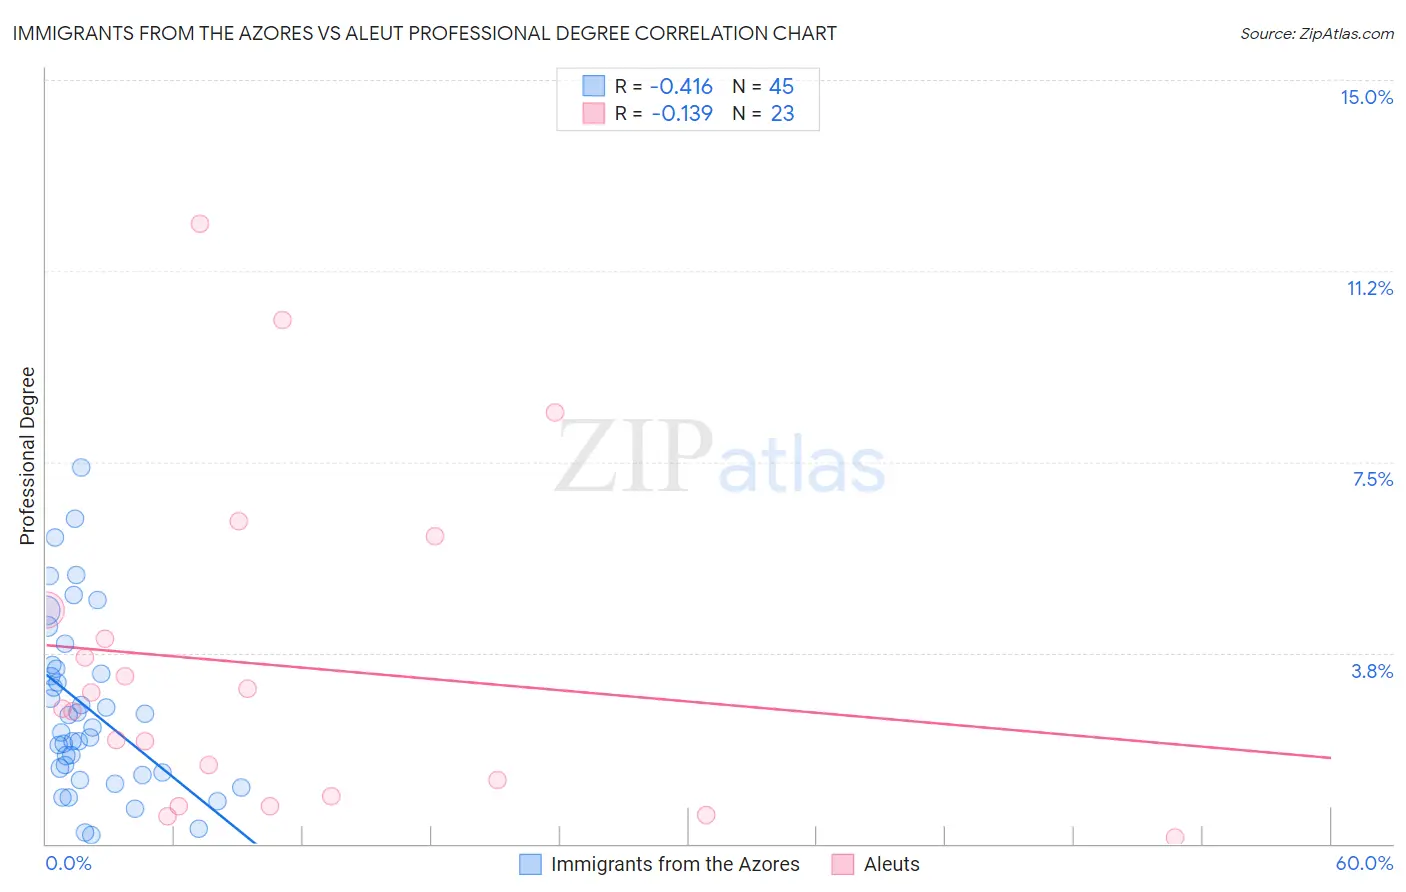
Immigrants from the Azores vs Aleut Professional Degree Correlation Chart
The statistical analysis conducted on geographies consisting of 46,201,665 people shows a moderate negative correlation between the proportion of Immigrants from the Azores and percentage of population with at least professional degree education in the United States with a correlation coefficient (R) of -0.416 and weighted average of 2.8%. Similarly, the statistical analysis conducted on geographies consisting of 61,685,490 people shows a poor negative correlation between the proportion of Aleuts and percentage of population with at least professional degree education in the United States with a correlation coefficient (R) of -0.139 and weighted average of 3.6%, a difference of 27.9%.
Professional Degree Correlation Summary
| Measurement | Immigrants from the Azores | Aleut |
| Minimum | 0.17% | 0.13% |
| Maximum | 7.4% | 12.2% |
| Range | 7.2% | 12.1% |
| Mean | 2.7% | 3.5% |
| Median | 2.3% | 2.6% |
| Interquartile 25% (IQ1) | 1.4% | 0.93% |
| Interquartile 75% (IQ3) | 3.5% | 4.6% |
| Interquartile Range (IQR) | 2.1% | 3.7% |
| Standard Deviation (Sample) | 1.7% | 3.2% |
| Standard Deviation (Population) | 1.7% | 3.1% |
Similar Demographics by Professional Degree
Demographics Similar to Immigrants from the Azores by Professional Degree
In terms of professional degree, the demographic groups most similar to Immigrants from the Azores are Tohono O'odham (2.8%, a difference of 0.66%), Yup'ik (2.9%, a difference of 1.4%), Immigrants from Central America (2.9%, a difference of 1.5%), Navajo (2.9%, a difference of 1.6%), and Arapaho (2.9%, a difference of 1.7%).
| Demographics | Rating | Rank | Professional Degree |
| Puget Sound Salish | 0.0 /100 | #333 | Tragic 3.1% |
| Pennsylvania Germans | 0.0 /100 | #334 | Tragic 3.0% |
| Natives/Alaskans | 0.0 /100 | #335 | Tragic 3.0% |
| Fijians | 0.0 /100 | #336 | Tragic 2.9% |
| Arapaho | 0.0 /100 | #337 | Tragic 2.9% |
| Navajo | 0.0 /100 | #338 | Tragic 2.9% |
| Immigrants | Central America | 0.0 /100 | #339 | Tragic 2.9% |
| Yup'ik | 0.0 /100 | #340 | Tragic 2.9% |
| Tohono O'odham | 0.0 /100 | #341 | Tragic 2.8% |
| Immigrants | Azores | 0.0 /100 | #342 | Tragic 2.8% |
| Mexicans | 0.0 /100 | #343 | Tragic 2.7% |
| Spanish American Indians | 0.0 /100 | #344 | Tragic 2.7% |
| Immigrants | Mexico | 0.0 /100 | #345 | Tragic 2.6% |
| Lumbee | 0.0 /100 | #346 | Tragic 2.5% |
| Houma | 0.0 /100 | #347 | Tragic 2.2% |
Demographics Similar to Aleuts by Professional Degree
In terms of professional degree, the demographic groups most similar to Aleuts are Delaware (3.6%, a difference of 0.15%), Central American Indian (3.6%, a difference of 0.42%), Immigrants from Cuba (3.6%, a difference of 0.60%), Immigrants from Congo (3.6%, a difference of 0.74%), and Immigrants from Cambodia (3.6%, a difference of 0.78%).
| Demographics | Rating | Rank | Professional Degree |
| Immigrants | Guyana | 1.0 /100 | #261 | Tragic 3.7% |
| U.S. Virgin Islanders | 1.0 /100 | #262 | Tragic 3.7% |
| Hopi | 0.9 /100 | #263 | Tragic 3.6% |
| Immigrants | Cambodia | 0.9 /100 | #264 | Tragic 3.6% |
| Immigrants | Congo | 0.8 /100 | #265 | Tragic 3.6% |
| Central American Indians | 0.8 /100 | #266 | Tragic 3.6% |
| Delaware | 0.7 /100 | #267 | Tragic 3.6% |
| Aleuts | 0.7 /100 | #268 | Tragic 3.6% |
| Immigrants | Cuba | 0.6 /100 | #269 | Tragic 3.6% |
| Central Americans | 0.6 /100 | #270 | Tragic 3.6% |
| Belizeans | 0.5 /100 | #271 | Tragic 3.6% |
| Immigrants | Jamaica | 0.5 /100 | #272 | Tragic 3.6% |
| Americans | 0.5 /100 | #273 | Tragic 3.6% |
| Potawatomi | 0.5 /100 | #274 | Tragic 3.6% |
| Immigrants | Dominica | 0.5 /100 | #275 | Tragic 3.6% |