Iranian vs Puerto Rican College, 1 year or more
COMPARE
Iranian
Puerto Rican
College, 1 year or more
College, 1 year or more Comparison
Iranians
Puerto Ricans
70.0%
COLLEGE, 1 YEAR OR MORE
100.0/ 100
METRIC RATING
3rd/ 347
METRIC RANK
52.2%
COLLEGE, 1 YEAR OR MORE
0.0/ 100
METRIC RATING
302nd/ 347
METRIC RANK
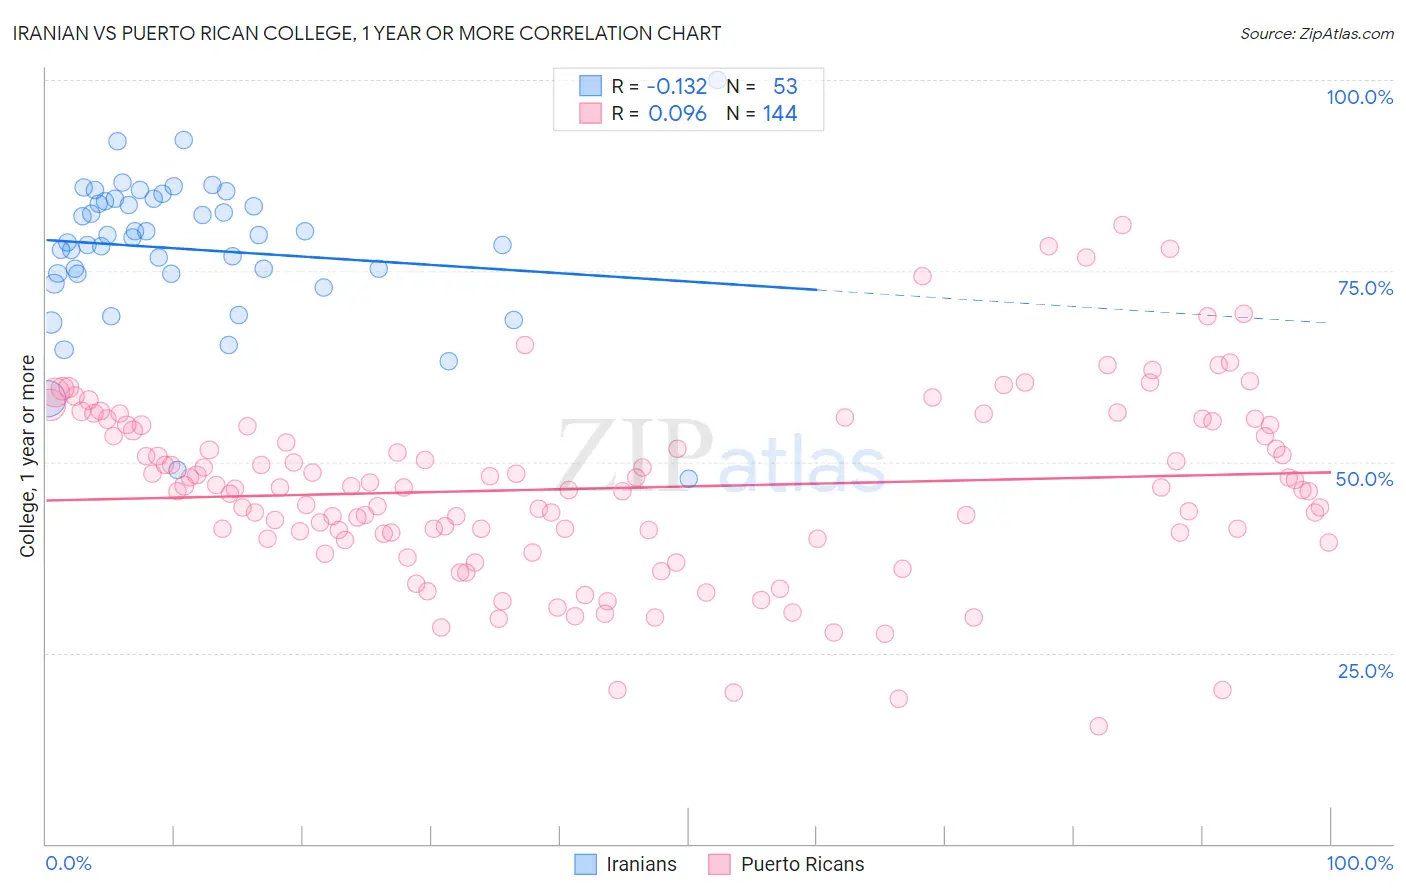
Iranian vs Puerto Rican College, 1 year or more Correlation Chart
The statistical analysis conducted on geographies consisting of 316,900,663 people shows a poor negative correlation between the proportion of Iranians and percentage of population with at least college, 1 year or more education in the United States with a correlation coefficient (R) of -0.132 and weighted average of 70.0%. Similarly, the statistical analysis conducted on geographies consisting of 528,315,563 people shows a slight positive correlation between the proportion of Puerto Ricans and percentage of population with at least college, 1 year or more education in the United States with a correlation coefficient (R) of 0.096 and weighted average of 52.2%, a difference of 34.0%.
College, 1 year or more Correlation Summary
| Measurement | Iranian | Puerto Rican |
| Minimum | 47.7% | 15.4% |
| Maximum | 100.0% | 81.0% |
| Range | 52.3% | 65.6% |
| Mean | 77.8% | 46.6% |
| Median | 79.4% | 46.6% |
| Interquartile 25% (IQ1) | 74.6% | 40.3% |
| Interquartile 75% (IQ3) | 84.2% | 54.8% |
| Interquartile Range (IQR) | 9.7% | 14.5% |
| Standard Deviation (Sample) | 9.6% | 12.0% |
| Standard Deviation (Population) | 9.6% | 12.0% |
Similar Demographics by College, 1 year or more
Demographics Similar to Iranians by College, 1 year or more
In terms of college, 1 year or more, the demographic groups most similar to Iranians are Immigrants from Singapore (70.1%, a difference of 0.22%), Immigrants from Taiwan (69.6%, a difference of 0.49%), Immigrants from India (69.6%, a difference of 0.49%), Immigrants from Iran (69.5%, a difference of 0.70%), and Filipino (71.0%, a difference of 1.4%).
| Demographics | Rating | Rank | College, 1 year or more |
| Filipinos | 100.0 /100 | #1 | Exceptional 71.0% |
| Immigrants | Singapore | 100.0 /100 | #2 | Exceptional 70.1% |
| Iranians | 100.0 /100 | #3 | Exceptional 70.0% |
| Immigrants | Taiwan | 100.0 /100 | #4 | Exceptional 69.6% |
| Immigrants | India | 100.0 /100 | #5 | Exceptional 69.6% |
| Immigrants | Iran | 100.0 /100 | #6 | Exceptional 69.5% |
| Okinawans | 100.0 /100 | #7 | Exceptional 69.0% |
| Thais | 100.0 /100 | #8 | Exceptional 68.6% |
| Immigrants | Israel | 100.0 /100 | #9 | Exceptional 67.8% |
| Immigrants | Australia | 100.0 /100 | #10 | Exceptional 67.7% |
| Immigrants | South Central Asia | 100.0 /100 | #11 | Exceptional 67.1% |
| Cypriots | 100.0 /100 | #12 | Exceptional 67.0% |
| Immigrants | Sweden | 100.0 /100 | #13 | Exceptional 66.8% |
| Burmese | 100.0 /100 | #14 | Exceptional 66.7% |
| Cambodians | 100.0 /100 | #15 | Exceptional 66.7% |
Demographics Similar to Puerto Ricans by College, 1 year or more
In terms of college, 1 year or more, the demographic groups most similar to Puerto Ricans are Creek (52.2%, a difference of 0.080%), Haitian (52.3%, a difference of 0.13%), Choctaw (52.3%, a difference of 0.19%), Central American (52.1%, a difference of 0.21%), and Immigrants from Nicaragua (52.4%, a difference of 0.23%).
| Demographics | Rating | Rank | College, 1 year or more |
| Yaqui | 0.0 /100 | #295 | Tragic 53.2% |
| Sioux | 0.0 /100 | #296 | Tragic 53.0% |
| Paiute | 0.0 /100 | #297 | Tragic 52.9% |
| Immigrants | Dominica | 0.0 /100 | #298 | Tragic 52.5% |
| Immigrants | Nicaragua | 0.0 /100 | #299 | Tragic 52.4% |
| Choctaw | 0.0 /100 | #300 | Tragic 52.3% |
| Haitians | 0.0 /100 | #301 | Tragic 52.3% |
| Puerto Ricans | 0.0 /100 | #302 | Tragic 52.2% |
| Creek | 0.0 /100 | #303 | Tragic 52.2% |
| Central Americans | 0.0 /100 | #304 | Tragic 52.1% |
| Seminole | 0.0 /100 | #305 | Tragic 52.1% |
| Mexican American Indians | 0.0 /100 | #306 | Tragic 51.9% |
| Immigrants | Portugal | 0.0 /100 | #307 | Tragic 51.9% |
| Salvadorans | 0.0 /100 | #308 | Tragic 51.8% |
| Apache | 0.0 /100 | #309 | Tragic 51.8% |