Venezuelan vs Immigrants from Germany College, Under 1 year
COMPARE
Venezuelan
Immigrants from Germany
College, Under 1 year
College, Under 1 year Comparison
Venezuelans
Immigrants from Germany
66.7%
COLLEGE, UNDER 1 YEAR
85.9/ 100
METRIC RATING
139th/ 347
METRIC RANK
66.5%
COLLEGE, UNDER 1 YEAR
82.0/ 100
METRIC RATING
144th/ 347
METRIC RANK
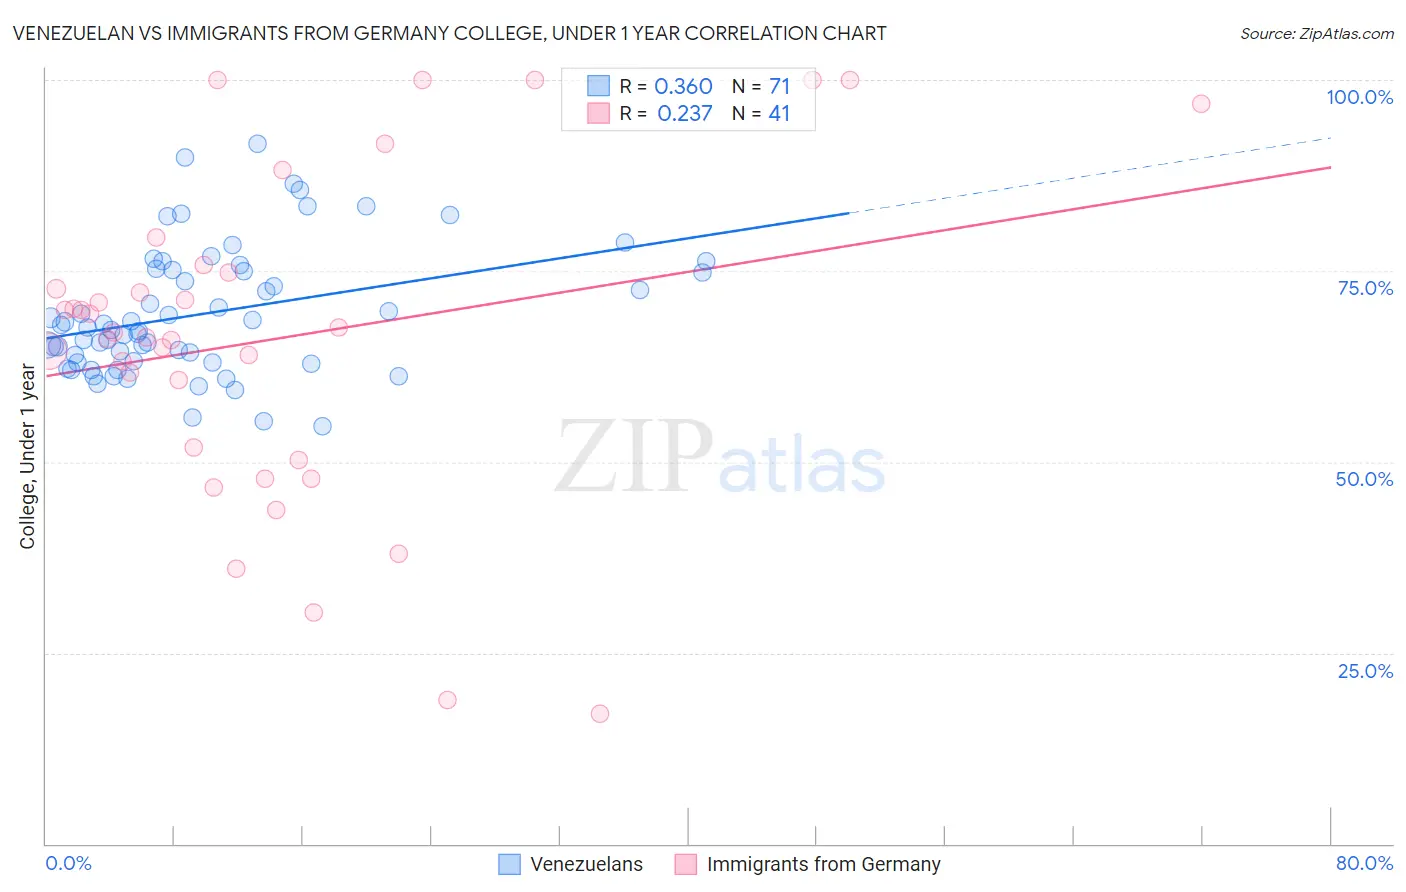
Venezuelan vs Immigrants from Germany College, Under 1 year Correlation Chart
The statistical analysis conducted on geographies consisting of 306,323,601 people shows a mild positive correlation between the proportion of Venezuelans and percentage of population with at least college, under 1 year education in the United States with a correlation coefficient (R) of 0.360 and weighted average of 66.7%. Similarly, the statistical analysis conducted on geographies consisting of 463,885,143 people shows a weak positive correlation between the proportion of Immigrants from Germany and percentage of population with at least college, under 1 year education in the United States with a correlation coefficient (R) of 0.237 and weighted average of 66.5%, a difference of 0.32%.
College, Under 1 year Correlation Summary
| Measurement | Venezuelan | Immigrants from Germany |
| Minimum | 54.6% | 17.0% |
| Maximum | 91.7% | 100.0% |
| Range | 37.1% | 83.0% |
| Mean | 69.4% | 66.2% |
| Median | 67.5% | 66.9% |
| Interquartile 25% (IQ1) | 63.1% | 51.1% |
| Interquartile 75% (IQ3) | 75.1% | 75.3% |
| Interquartile Range (IQR) | 12.0% | 24.2% |
| Standard Deviation (Sample) | 8.3% | 21.2% |
| Standard Deviation (Population) | 8.2% | 21.0% |
Demographics Similar to Venezuelans and Immigrants from Germany by College, Under 1 year
In terms of college, under 1 year, the demographic groups most similar to Venezuelans are Slavic (66.7%, a difference of 0.0%), Immigrants from Afghanistan (66.7%, a difference of 0.070%), Immigrants from Italy (66.8%, a difference of 0.10%), Immigrants from Chile (66.8%, a difference of 0.14%), and Ugandan (66.8%, a difference of 0.18%). Similarly, the demographic groups most similar to Immigrants from Germany are Immigrants from Kenya (66.5%, a difference of 0.010%), Kenyan (66.5%, a difference of 0.020%), Immigrants from Morocco (66.5%, a difference of 0.020%), Immigrants from Uganda (66.5%, a difference of 0.060%), and English (66.6%, a difference of 0.070%).
| Demographics | Rating | Rank | College, Under 1 year |
| Finns | 88.6 /100 | #131 | Excellent 66.9% |
| Poles | 88.4 /100 | #132 | Excellent 66.9% |
| Immigrants | Brazil | 88.3 /100 | #133 | Excellent 66.9% |
| Iraqis | 88.0 /100 | #134 | Excellent 66.8% |
| Canadians | 87.9 /100 | #135 | Excellent 66.8% |
| Ugandans | 87.8 /100 | #136 | Excellent 66.8% |
| Immigrants | Chile | 87.4 /100 | #137 | Excellent 66.8% |
| Immigrants | Italy | 86.9 /100 | #138 | Excellent 66.8% |
| Venezuelans | 85.9 /100 | #139 | Excellent 66.7% |
| Slavs | 85.9 /100 | #140 | Excellent 66.7% |
| Immigrants | Afghanistan | 85.1 /100 | #141 | Excellent 66.7% |
| English | 82.9 /100 | #142 | Excellent 66.6% |
| Immigrants | Uganda | 82.8 /100 | #143 | Excellent 66.5% |
| Immigrants | Germany | 82.0 /100 | #144 | Excellent 66.5% |
| Immigrants | Kenya | 81.8 /100 | #145 | Excellent 66.5% |
| Kenyans | 81.7 /100 | #146 | Excellent 66.5% |
| Immigrants | Morocco | 81.7 /100 | #147 | Excellent 66.5% |
| Taiwanese | 78.6 /100 | #148 | Good 66.4% |
| Immigrants | Venezuela | 77.9 /100 | #149 | Good 66.3% |
| Immigrants | Iraq | 77.1 /100 | #150 | Good 66.3% |
| Immigrants | Sudan | 76.0 /100 | #151 | Good 66.2% |