Comanche vs Cree Cognitive Disability
COMPARE
Comanche
Cree
Cognitive Disability
Cognitive Disability Comparison
Comanche
Cree
18.6%
COGNITIVE DISABILITY
0.0/ 100
METRIC RATING
319th/ 347
METRIC RANK
17.9%
COGNITIVE DISABILITY
0.7/ 100
METRIC RATING
249th/ 347
METRIC RANK
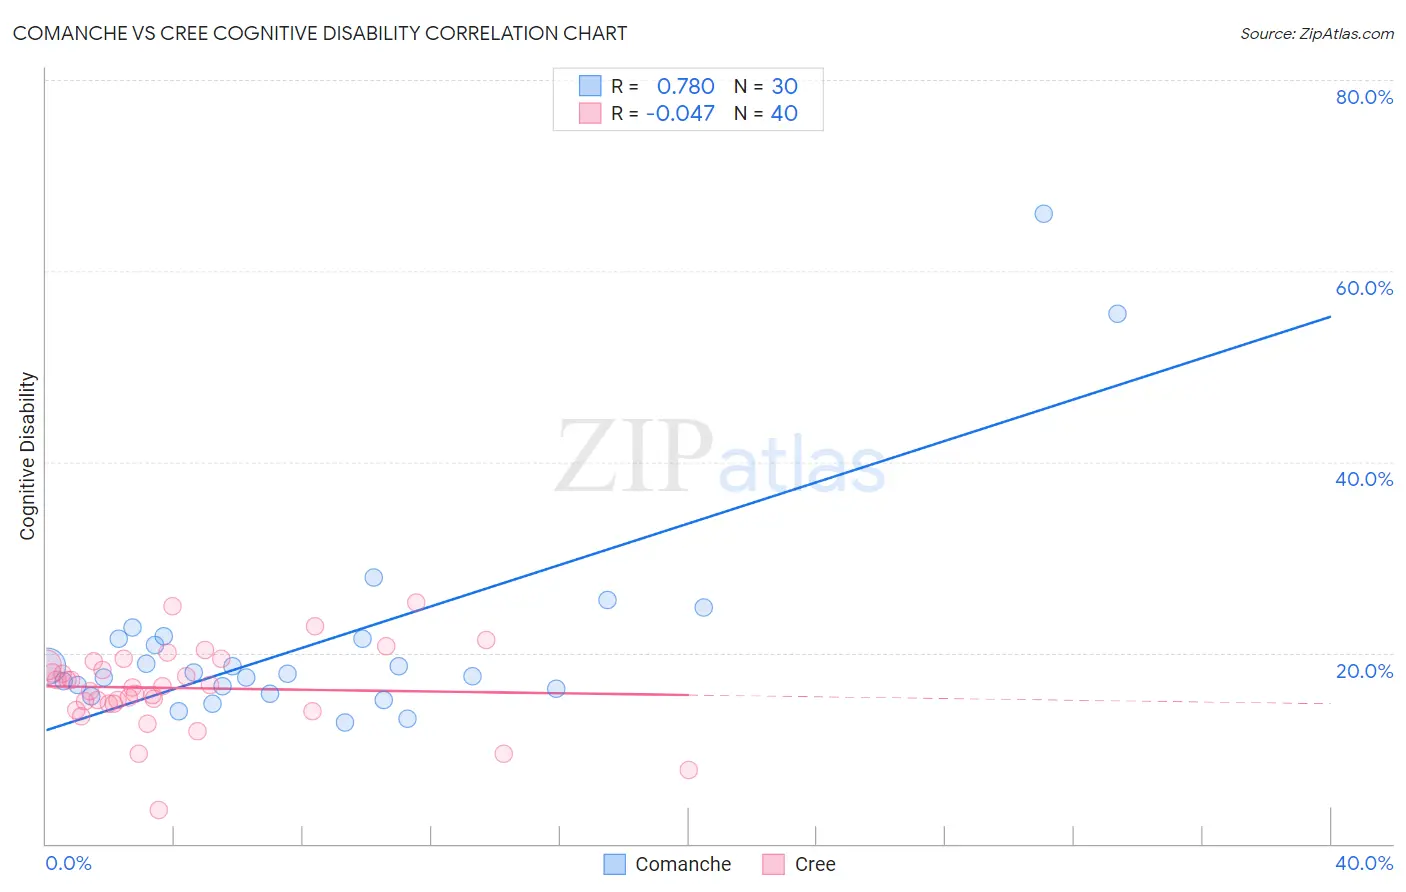
Comanche vs Cree Cognitive Disability Correlation Chart
The statistical analysis conducted on geographies consisting of 109,776,806 people shows a strong positive correlation between the proportion of Comanche and percentage of population with cognitive disability in the United States with a correlation coefficient (R) of 0.780 and weighted average of 18.6%. Similarly, the statistical analysis conducted on geographies consisting of 76,210,632 people shows no correlation between the proportion of Cree and percentage of population with cognitive disability in the United States with a correlation coefficient (R) of -0.047 and weighted average of 17.9%, a difference of 4.0%.
Cognitive Disability Correlation Summary
| Measurement | Comanche | Cree |
| Minimum | 12.7% | 3.6% |
| Maximum | 66.0% | 25.2% |
| Range | 53.3% | 21.7% |
| Mean | 21.3% | 16.3% |
| Median | 17.9% | 16.4% |
| Interquartile 25% (IQ1) | 16.2% | 14.7% |
| Interquartile 75% (IQ3) | 21.5% | 18.9% |
| Interquartile Range (IQR) | 5.3% | 4.2% |
| Standard Deviation (Sample) | 11.4% | 4.3% |
| Standard Deviation (Population) | 11.2% | 4.2% |
Similar Demographics by Cognitive Disability
Demographics Similar to Comanche by Cognitive Disability
In terms of cognitive disability, the demographic groups most similar to Comanche are Bangladeshi (18.6%, a difference of 0.040%), Apache (18.6%, a difference of 0.040%), African (18.6%, a difference of 0.13%), Liberian (18.6%, a difference of 0.16%), and Immigrants from Liberia (18.7%, a difference of 0.19%).
| Demographics | Rating | Rank | Cognitive Disability |
| Chickasaw | 0.0 /100 | #312 | Tragic 18.5% |
| Yaqui | 0.0 /100 | #313 | Tragic 18.5% |
| Sub-Saharan Africans | 0.0 /100 | #314 | Tragic 18.5% |
| Immigrants | Dominica | 0.0 /100 | #315 | Tragic 18.6% |
| Immigrants | Middle Africa | 0.0 /100 | #316 | Tragic 18.6% |
| Liberians | 0.0 /100 | #317 | Tragic 18.6% |
| Bangladeshis | 0.0 /100 | #318 | Tragic 18.6% |
| Comanche | 0.0 /100 | #319 | Tragic 18.6% |
| Apache | 0.0 /100 | #320 | Tragic 18.6% |
| Africans | 0.0 /100 | #321 | Tragic 18.6% |
| Immigrants | Liberia | 0.0 /100 | #322 | Tragic 18.7% |
| Pueblo | 0.0 /100 | #323 | Tragic 18.7% |
| Dominicans | 0.0 /100 | #324 | Tragic 18.7% |
| Indonesians | 0.0 /100 | #325 | Tragic 18.7% |
| Immigrants | Senegal | 0.0 /100 | #326 | Tragic 18.7% |
Demographics Similar to Cree by Cognitive Disability
In terms of cognitive disability, the demographic groups most similar to Cree are Immigrants from Ethiopia (17.9%, a difference of 0.0%), Malaysian (17.9%, a difference of 0.010%), Immigrants from Grenada (17.9%, a difference of 0.020%), Hopi (17.9%, a difference of 0.030%), and Hispanic or Latino (17.9%, a difference of 0.030%).
| Demographics | Rating | Rank | Cognitive Disability |
| Paiute | 1.1 /100 | #242 | Tragic 17.8% |
| Immigrants | Bangladesh | 1.0 /100 | #243 | Tragic 17.8% |
| Jamaicans | 0.9 /100 | #244 | Tragic 17.9% |
| Trinidadians and Tobagonians | 0.8 /100 | #245 | Tragic 17.9% |
| Immigrants | Thailand | 0.8 /100 | #246 | Tragic 17.9% |
| Samoans | 0.7 /100 | #247 | Tragic 17.9% |
| French American Indians | 0.7 /100 | #248 | Tragic 17.9% |
| Cree | 0.7 /100 | #249 | Tragic 17.9% |
| Immigrants | Ethiopia | 0.7 /100 | #250 | Tragic 17.9% |
| Malaysians | 0.6 /100 | #251 | Tragic 17.9% |
| Immigrants | Grenada | 0.6 /100 | #252 | Tragic 17.9% |
| Hopi | 0.6 /100 | #253 | Tragic 17.9% |
| Hispanics or Latinos | 0.6 /100 | #254 | Tragic 17.9% |
| Immigrants | Azores | 0.6 /100 | #255 | Tragic 17.9% |
| Bahamians | 0.6 /100 | #256 | Tragic 17.9% |