Colombian vs New Zealander Unemployment Among Seniors over 75 years
COMPARE
Colombian
New Zealander
Unemployment Among Seniors over 75 years
Unemployment Among Seniors over 75 years Comparison
Colombians
New Zealanders
8.5%
UNEMPLOYMENT AMONG SENIORS OVER 75 YEARS
86.7/ 100
METRIC RATING
144th/ 347
METRIC RANK
8.1%
UNEMPLOYMENT AMONG SENIORS OVER 75 YEARS
99.5/ 100
METRIC RATING
88th/ 347
METRIC RANK
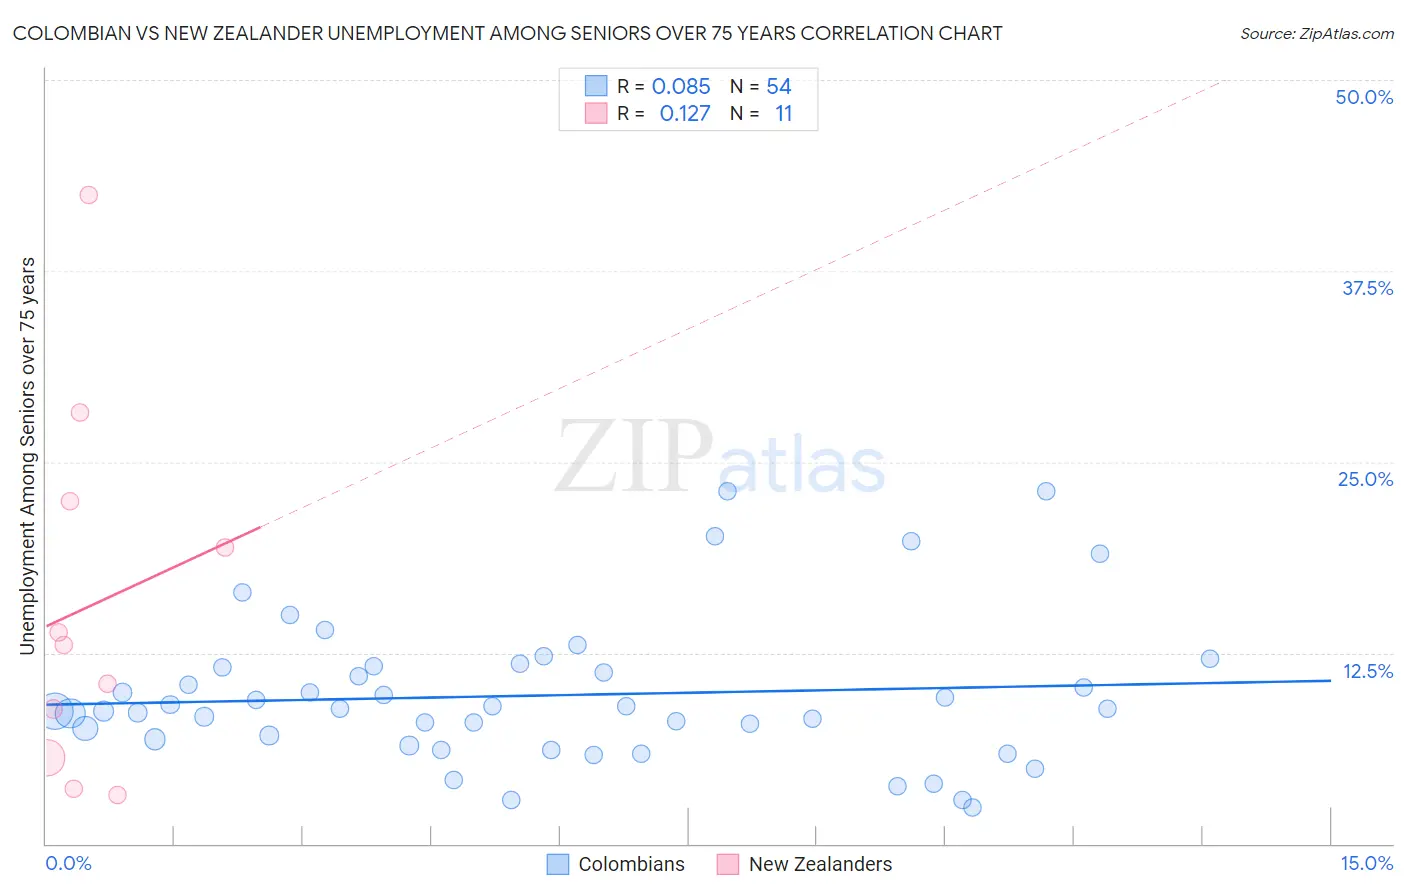
Colombian vs New Zealander Unemployment Among Seniors over 75 years Correlation Chart
The statistical analysis conducted on geographies consisting of 208,755,623 people shows a slight positive correlation between the proportion of Colombians and unemployment rate among seniors over the age of 75 in the United States with a correlation coefficient (R) of 0.085 and weighted average of 8.5%. Similarly, the statistical analysis conducted on geographies consisting of 82,204,458 people shows a poor positive correlation between the proportion of New Zealanders and unemployment rate among seniors over the age of 75 in the United States with a correlation coefficient (R) of 0.127 and weighted average of 8.1%, a difference of 5.0%.
Unemployment Among Seniors over 75 years Correlation Summary
| Measurement | Colombian | New Zealander |
| Minimum | 2.4% | 3.2% |
| Maximum | 23.1% | 42.5% |
| Range | 20.7% | 39.3% |
| Mean | 9.7% | 15.6% |
| Median | 8.8% | 13.0% |
| Interquartile 25% (IQ1) | 6.8% | 5.6% |
| Interquartile 75% (IQ3) | 11.5% | 22.4% |
| Interquartile Range (IQR) | 4.7% | 16.8% |
| Standard Deviation (Sample) | 4.7% | 11.9% |
| Standard Deviation (Population) | 4.7% | 11.4% |
Similar Demographics by Unemployment Among Seniors over 75 years
Demographics Similar to Colombians by Unemployment Among Seniors over 75 years
In terms of unemployment among seniors over 75 years, the demographic groups most similar to Colombians are Immigrants from Costa Rica (8.5%, a difference of 0.010%), Immigrants from Ukraine (8.5%, a difference of 0.040%), Immigrants from Romania (8.5%, a difference of 0.060%), Immigrants from South Eastern Asia (8.5%, a difference of 0.11%), and Immigrants from Sierra Leone (8.5%, a difference of 0.13%).
| Demographics | Rating | Rank | Unemployment Among Seniors over 75 years |
| Immigrants | Kuwait | 90.5 /100 | #137 | Exceptional 8.5% |
| Immigrants | Bulgaria | 89.6 /100 | #138 | Excellent 8.5% |
| Barbadians | 88.6 /100 | #139 | Excellent 8.5% |
| South Americans | 87.9 /100 | #140 | Excellent 8.5% |
| Immigrants | Bolivia | 87.9 /100 | #141 | Excellent 8.5% |
| Immigrants | Ukraine | 87.0 /100 | #142 | Excellent 8.5% |
| Immigrants | Costa Rica | 86.8 /100 | #143 | Excellent 8.5% |
| Colombians | 86.7 /100 | #144 | Excellent 8.5% |
| Immigrants | Romania | 86.2 /100 | #145 | Excellent 8.5% |
| Immigrants | South Eastern Asia | 85.8 /100 | #146 | Excellent 8.5% |
| Immigrants | Sierra Leone | 85.6 /100 | #147 | Excellent 8.5% |
| Immigrants | Colombia | 85.6 /100 | #148 | Excellent 8.5% |
| Immigrants | Ecuador | 84.6 /100 | #149 | Excellent 8.5% |
| Paiute | 82.5 /100 | #150 | Excellent 8.6% |
| Immigrants | Bosnia and Herzegovina | 80.6 /100 | #151 | Excellent 8.6% |
Demographics Similar to New Zealanders by Unemployment Among Seniors over 75 years
In terms of unemployment among seniors over 75 years, the demographic groups most similar to New Zealanders are Immigrants from Korea (8.1%, a difference of 0.010%), Basque (8.1%, a difference of 0.040%), Immigrants from Vietnam (8.1%, a difference of 0.090%), Egyptian (8.1%, a difference of 0.13%), and Venezuelan (8.1%, a difference of 0.13%).
| Demographics | Rating | Rank | Unemployment Among Seniors over 75 years |
| Cubans | 99.7 /100 | #81 | Exceptional 8.0% |
| Bhutanese | 99.7 /100 | #82 | Exceptional 8.0% |
| Arapaho | 99.7 /100 | #83 | Exceptional 8.1% |
| U.S. Virgin Islanders | 99.7 /100 | #84 | Exceptional 8.1% |
| Immigrants | Indonesia | 99.7 /100 | #85 | Exceptional 8.1% |
| Immigrants | Singapore | 99.7 /100 | #86 | Exceptional 8.1% |
| Basques | 99.5 /100 | #87 | Exceptional 8.1% |
| New Zealanders | 99.5 /100 | #88 | Exceptional 8.1% |
| Immigrants | Korea | 99.5 /100 | #89 | Exceptional 8.1% |
| Immigrants | Vietnam | 99.5 /100 | #90 | Exceptional 8.1% |
| Egyptians | 99.5 /100 | #91 | Exceptional 8.1% |
| Venezuelans | 99.5 /100 | #92 | Exceptional 8.1% |
| Immigrants | Netherlands | 99.5 /100 | #93 | Exceptional 8.1% |
| Immigrants | Ireland | 99.4 /100 | #94 | Exceptional 8.1% |
| Nicaraguans | 99.3 /100 | #95 | Exceptional 8.2% |