Colombian vs Comanche Single Father Poverty
COMPARE
Colombian
Comanche
Single Father Poverty
Single Father Poverty Comparison
Colombians
Comanche
16.1%
SINGLE FATHER POVERTY
77.1/ 100
METRIC RATING
147th/ 347
METRIC RANK
18.5%
SINGLE FATHER POVERTY
0.0/ 100
METRIC RATING
302nd/ 347
METRIC RANK
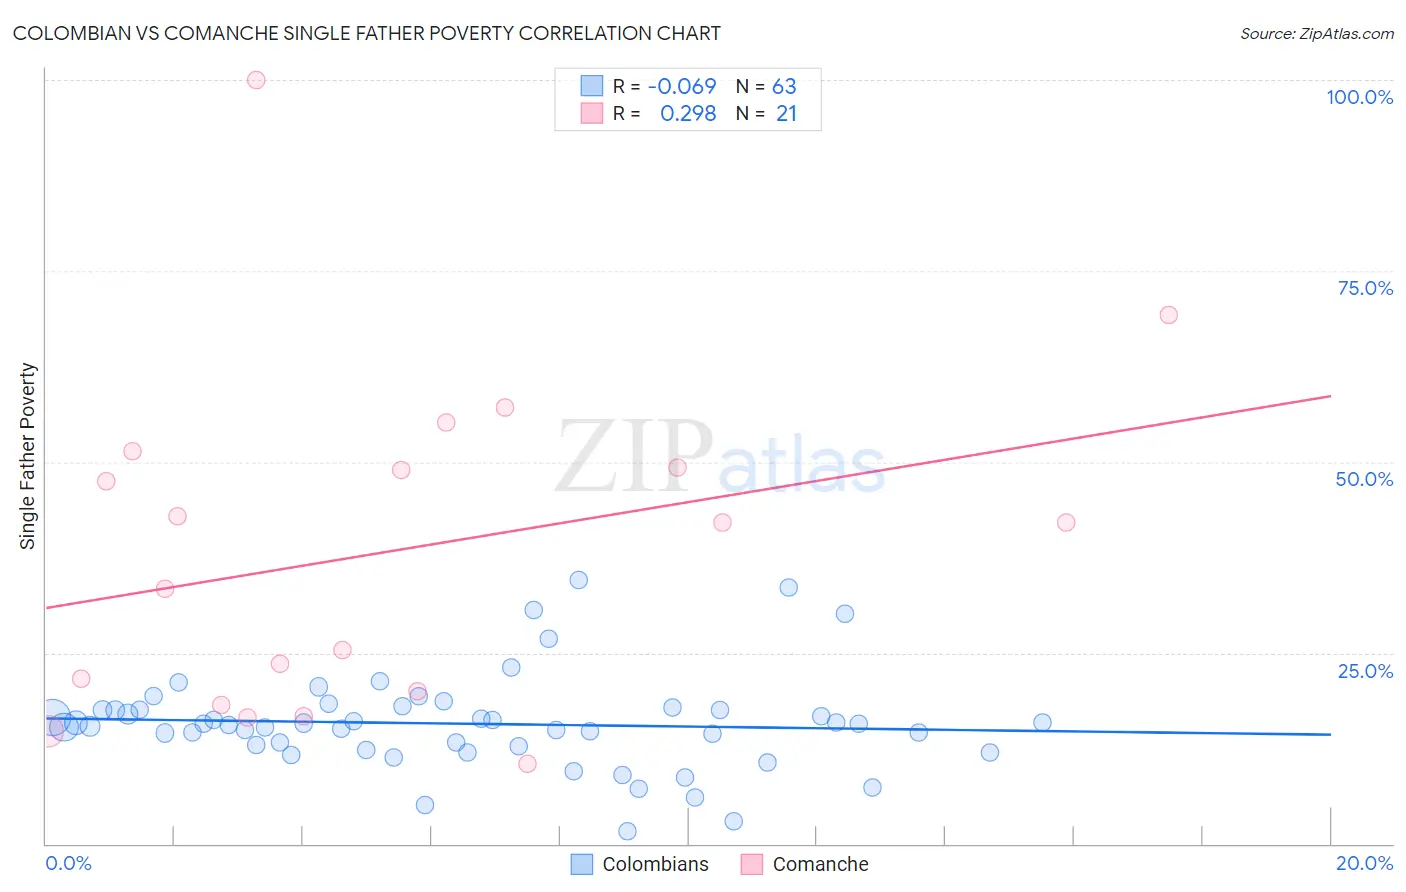
Colombian vs Comanche Single Father Poverty Correlation Chart
The statistical analysis conducted on geographies consisting of 329,050,963 people shows a slight negative correlation between the proportion of Colombians and poverty level among single fathers in the United States with a correlation coefficient (R) of -0.069 and weighted average of 16.1%. Similarly, the statistical analysis conducted on geographies consisting of 100,339,334 people shows a weak positive correlation between the proportion of Comanche and poverty level among single fathers in the United States with a correlation coefficient (R) of 0.298 and weighted average of 18.5%, a difference of 14.9%.
Single Father Poverty Correlation Summary
| Measurement | Colombian | Comanche |
| Minimum | 1.6% | 10.5% |
| Maximum | 34.5% | 100.0% |
| Range | 32.9% | 89.5% |
| Mean | 15.7% | 38.4% |
| Median | 15.6% | 42.1% |
| Interquartile 25% (IQ1) | 12.8% | 19.1% |
| Interquartile 75% (IQ3) | 17.5% | 50.3% |
| Interquartile Range (IQR) | 4.7% | 31.2% |
| Standard Deviation (Sample) | 6.2% | 21.9% |
| Standard Deviation (Population) | 6.2% | 21.4% |
Similar Demographics by Single Father Poverty
Demographics Similar to Colombians by Single Father Poverty
In terms of single father poverty, the demographic groups most similar to Colombians are Nigerian (16.1%, a difference of 0.020%), Immigrants from Hungary (16.1%, a difference of 0.080%), South African (16.1%, a difference of 0.12%), Jordanian (16.1%, a difference of 0.18%), and Immigrants from Western Asia (16.0%, a difference of 0.24%).
| Demographics | Rating | Rank | Single Father Poverty |
| Immigrants | Netherlands | 85.3 /100 | #140 | Excellent 16.0% |
| Liberians | 83.3 /100 | #141 | Excellent 16.0% |
| Immigrants | Mexico | 83.3 /100 | #142 | Excellent 16.0% |
| Immigrants | Central America | 83.1 /100 | #143 | Excellent 16.0% |
| Immigrants | Kuwait | 81.4 /100 | #144 | Excellent 16.0% |
| Immigrants | Western Asia | 80.7 /100 | #145 | Excellent 16.0% |
| Immigrants | Hungary | 78.3 /100 | #146 | Good 16.1% |
| Colombians | 77.1 /100 | #147 | Good 16.1% |
| Nigerians | 76.8 /100 | #148 | Good 16.1% |
| South Africans | 75.1 /100 | #149 | Good 16.1% |
| Jordanians | 74.2 /100 | #150 | Good 16.1% |
| Immigrants | France | 73.1 /100 | #151 | Good 16.1% |
| Immigrants | Zimbabwe | 72.1 /100 | #152 | Good 16.1% |
| Immigrants | Israel | 72.0 /100 | #153 | Good 16.1% |
| Mexicans | 70.1 /100 | #154 | Good 16.1% |
Demographics Similar to Comanche by Single Father Poverty
In terms of single father poverty, the demographic groups most similar to Comanche are Celtic (18.5%, a difference of 0.040%), Hungarian (18.5%, a difference of 0.11%), Ute (18.5%, a difference of 0.18%), Blackfeet (18.5%, a difference of 0.23%), and Immigrants from Dominican Republic (18.4%, a difference of 0.32%).
| Demographics | Rating | Rank | Single Father Poverty |
| Yakama | 0.0 /100 | #295 | Tragic 18.1% |
| Seminole | 0.0 /100 | #296 | Tragic 18.1% |
| French | 0.0 /100 | #297 | Tragic 18.2% |
| Africans | 0.0 /100 | #298 | Tragic 18.3% |
| Whites/Caucasians | 0.0 /100 | #299 | Tragic 18.4% |
| Immigrants | Dominican Republic | 0.0 /100 | #300 | Tragic 18.4% |
| Hungarians | 0.0 /100 | #301 | Tragic 18.5% |
| Comanche | 0.0 /100 | #302 | Tragic 18.5% |
| Celtics | 0.0 /100 | #303 | Tragic 18.5% |
| Ute | 0.0 /100 | #304 | Tragic 18.5% |
| Blackfeet | 0.0 /100 | #305 | Tragic 18.5% |
| Scotch-Irish | 0.0 /100 | #306 | Tragic 18.6% |
| French Canadians | 0.0 /100 | #307 | Tragic 18.6% |
| Ottawa | 0.0 /100 | #308 | Tragic 18.6% |
| Immigrants | Micronesia | 0.0 /100 | #309 | Tragic 18.6% |