Choctaw vs Immigrants from Sweden Associate's Degree
COMPARE
Choctaw
Immigrants from Sweden
Associate's Degree
Associate's Degree Comparison
Choctaw
Immigrants from Sweden
37.8%
ASSOCIATE'S DEGREE
0.0/ 100
METRIC RATING
312th/ 347
METRIC RANK
54.6%
ASSOCIATE'S DEGREE
100.0/ 100
METRIC RATING
21st/ 347
METRIC RANK
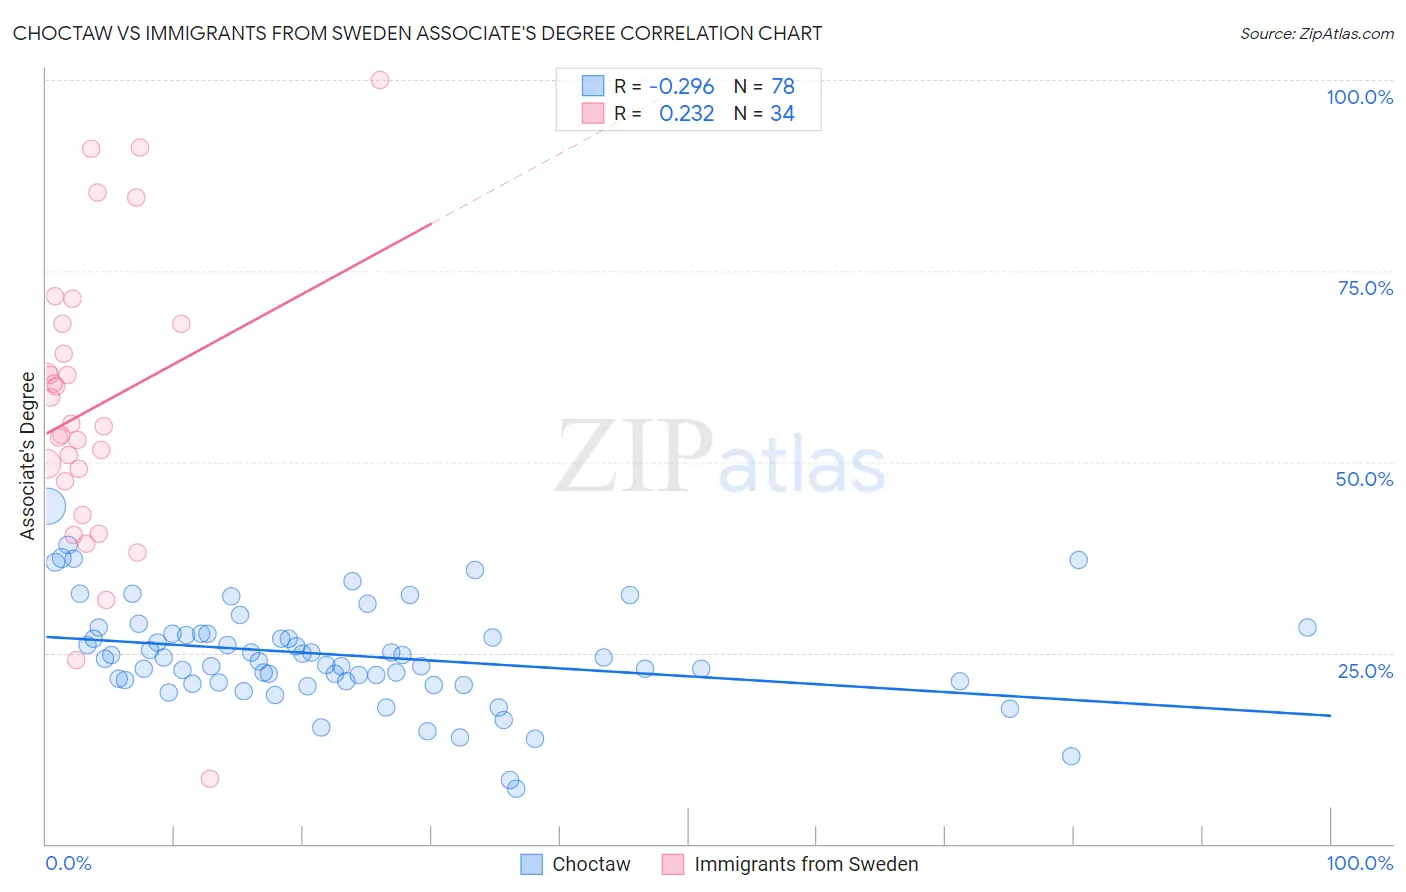
Choctaw vs Immigrants from Sweden Associate's Degree Correlation Chart
The statistical analysis conducted on geographies consisting of 269,730,992 people shows a weak negative correlation between the proportion of Choctaw and percentage of population with at least associate's degree education in the United States with a correlation coefficient (R) of -0.296 and weighted average of 37.8%. Similarly, the statistical analysis conducted on geographies consisting of 164,727,727 people shows a weak positive correlation between the proportion of Immigrants from Sweden and percentage of population with at least associate's degree education in the United States with a correlation coefficient (R) of 0.232 and weighted average of 54.6%, a difference of 44.5%.
Associate's Degree Correlation Summary
| Measurement | Choctaw | Immigrants from Sweden |
| Minimum | 7.1% | 8.6% |
| Maximum | 44.2% | 100.0% |
| Range | 37.1% | 91.4% |
| Mean | 24.7% | 57.1% |
| Median | 24.3% | 54.8% |
| Interquartile 25% (IQ1) | 21.2% | 47.4% |
| Interquartile 75% (IQ3) | 27.5% | 68.1% |
| Interquartile Range (IQR) | 6.3% | 20.7% |
| Standard Deviation (Sample) | 6.8% | 19.3% |
| Standard Deviation (Population) | 6.8% | 19.0% |
Similar Demographics by Associate's Degree
Demographics Similar to Choctaw by Associate's Degree
In terms of associate's degree, the demographic groups most similar to Choctaw are Hispanic or Latino (37.7%, a difference of 0.15%), Seminole (37.7%, a difference of 0.20%), Immigrants from Latin America (37.9%, a difference of 0.22%), Immigrants from Dominican Republic (37.9%, a difference of 0.33%), and Creek (37.6%, a difference of 0.59%).
| Demographics | Rating | Rank | Associate's Degree |
| Immigrants | Honduras | 0.0 /100 | #305 | Tragic 38.5% |
| Shoshone | 0.0 /100 | #306 | Tragic 38.4% |
| Immigrants | El Salvador | 0.0 /100 | #307 | Tragic 38.4% |
| Mexican American Indians | 0.0 /100 | #308 | Tragic 38.2% |
| Immigrants | Guatemala | 0.0 /100 | #309 | Tragic 38.1% |
| Immigrants | Dominican Republic | 0.0 /100 | #310 | Tragic 37.9% |
| Immigrants | Latin America | 0.0 /100 | #311 | Tragic 37.9% |
| Choctaw | 0.0 /100 | #312 | Tragic 37.8% |
| Hispanics or Latinos | 0.0 /100 | #313 | Tragic 37.7% |
| Seminole | 0.0 /100 | #314 | Tragic 37.7% |
| Creek | 0.0 /100 | #315 | Tragic 37.6% |
| Crow | 0.0 /100 | #316 | Tragic 37.6% |
| Yaqui | 0.0 /100 | #317 | Tragic 37.6% |
| Alaska Natives | 0.0 /100 | #318 | Tragic 37.5% |
| Fijians | 0.0 /100 | #319 | Tragic 37.4% |
Demographics Similar to Immigrants from Sweden by Associate's Degree
In terms of associate's degree, the demographic groups most similar to Immigrants from Sweden are Immigrants from Japan (54.6%, a difference of 0.030%), Burmese (54.6%, a difference of 0.030%), Cambodian (54.6%, a difference of 0.060%), Immigrants from Ireland (54.7%, a difference of 0.090%), and Immigrants from Korea (54.5%, a difference of 0.12%).
| Demographics | Rating | Rank | Associate's Degree |
| Immigrants | Hong Kong | 100.0 /100 | #14 | Exceptional 55.4% |
| Immigrants | Eastern Asia | 100.0 /100 | #15 | Exceptional 55.4% |
| Soviet Union | 100.0 /100 | #16 | Exceptional 55.1% |
| Eastern Europeans | 100.0 /100 | #17 | Exceptional 55.0% |
| Indians (Asian) | 100.0 /100 | #18 | Exceptional 54.8% |
| Immigrants | Ireland | 100.0 /100 | #19 | Exceptional 54.7% |
| Cambodians | 100.0 /100 | #20 | Exceptional 54.6% |
| Immigrants | Sweden | 100.0 /100 | #21 | Exceptional 54.6% |
| Immigrants | Japan | 100.0 /100 | #22 | Exceptional 54.6% |
| Burmese | 100.0 /100 | #23 | Exceptional 54.6% |
| Immigrants | Korea | 100.0 /100 | #24 | Exceptional 54.5% |
| Immigrants | Switzerland | 100.0 /100 | #25 | Exceptional 54.5% |
| Immigrants | Belgium | 100.0 /100 | #26 | Exceptional 54.5% |
| Latvians | 100.0 /100 | #27 | Exceptional 53.9% |
| Turks | 100.0 /100 | #28 | Exceptional 53.9% |