Choctaw vs Immigrants from Philippines Associate's Degree
COMPARE
Choctaw
Immigrants from Philippines
Associate's Degree
Associate's Degree Comparison
Choctaw
Immigrants from Philippines
37.8%
ASSOCIATE'S DEGREE
0.0/ 100
METRIC RATING
312th/ 347
METRIC RANK
45.0%
ASSOCIATE'S DEGREE
16.7/ 100
METRIC RATING
210th/ 347
METRIC RANK
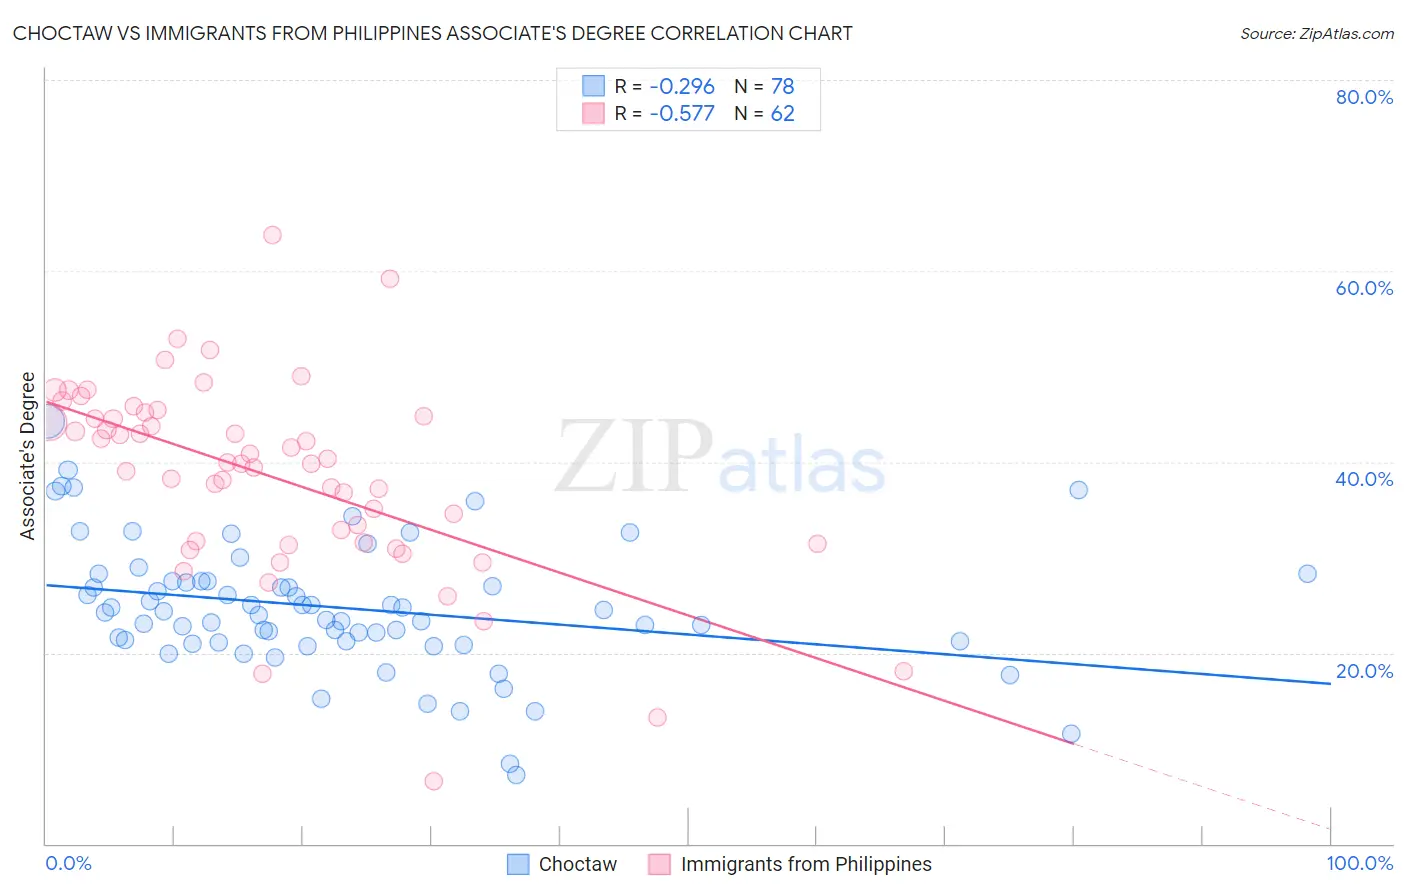
Choctaw vs Immigrants from Philippines Associate's Degree Correlation Chart
The statistical analysis conducted on geographies consisting of 269,730,992 people shows a weak negative correlation between the proportion of Choctaw and percentage of population with at least associate's degree education in the United States with a correlation coefficient (R) of -0.296 and weighted average of 37.8%. Similarly, the statistical analysis conducted on geographies consisting of 471,293,410 people shows a substantial negative correlation between the proportion of Immigrants from Philippines and percentage of population with at least associate's degree education in the United States with a correlation coefficient (R) of -0.577 and weighted average of 45.0%, a difference of 19.0%.
Associate's Degree Correlation Summary
| Measurement | Choctaw | Immigrants from Philippines |
| Minimum | 7.1% | 6.5% |
| Maximum | 44.2% | 63.7% |
| Range | 37.1% | 57.2% |
| Mean | 24.7% | 38.5% |
| Median | 24.3% | 39.9% |
| Interquartile 25% (IQ1) | 21.2% | 31.5% |
| Interquartile 75% (IQ3) | 27.5% | 44.8% |
| Interquartile Range (IQR) | 6.3% | 13.3% |
| Standard Deviation (Sample) | 6.8% | 10.2% |
| Standard Deviation (Population) | 6.8% | 10.2% |
Similar Demographics by Associate's Degree
Demographics Similar to Choctaw by Associate's Degree
In terms of associate's degree, the demographic groups most similar to Choctaw are Hispanic or Latino (37.7%, a difference of 0.15%), Seminole (37.7%, a difference of 0.20%), Immigrants from Latin America (37.9%, a difference of 0.22%), Immigrants from Dominican Republic (37.9%, a difference of 0.33%), and Creek (37.6%, a difference of 0.59%).
| Demographics | Rating | Rank | Associate's Degree |
| Immigrants | Honduras | 0.0 /100 | #305 | Tragic 38.5% |
| Shoshone | 0.0 /100 | #306 | Tragic 38.4% |
| Immigrants | El Salvador | 0.0 /100 | #307 | Tragic 38.4% |
| Mexican American Indians | 0.0 /100 | #308 | Tragic 38.2% |
| Immigrants | Guatemala | 0.0 /100 | #309 | Tragic 38.1% |
| Immigrants | Dominican Republic | 0.0 /100 | #310 | Tragic 37.9% |
| Immigrants | Latin America | 0.0 /100 | #311 | Tragic 37.9% |
| Choctaw | 0.0 /100 | #312 | Tragic 37.8% |
| Hispanics or Latinos | 0.0 /100 | #313 | Tragic 37.7% |
| Seminole | 0.0 /100 | #314 | Tragic 37.7% |
| Creek | 0.0 /100 | #315 | Tragic 37.6% |
| Crow | 0.0 /100 | #316 | Tragic 37.6% |
| Yaqui | 0.0 /100 | #317 | Tragic 37.6% |
| Alaska Natives | 0.0 /100 | #318 | Tragic 37.5% |
| Fijians | 0.0 /100 | #319 | Tragic 37.4% |
Demographics Similar to Immigrants from Philippines by Associate's Degree
In terms of associate's degree, the demographic groups most similar to Immigrants from Philippines are Immigrants from Costa Rica (45.0%, a difference of 0.010%), Immigrants from Zaire (45.0%, a difference of 0.010%), Dutch (45.0%, a difference of 0.12%), Panamanian (45.1%, a difference of 0.22%), and French Canadian (44.9%, a difference of 0.24%).
| Demographics | Rating | Rank | Associate's Degree |
| Immigrants | South Eastern Asia | 20.2 /100 | #203 | Fair 45.2% |
| Nigerians | 19.1 /100 | #204 | Poor 45.1% |
| Immigrants | Thailand | 18.9 /100 | #205 | Poor 45.1% |
| German Russians | 18.9 /100 | #206 | Poor 45.1% |
| Panamanians | 18.4 /100 | #207 | Poor 45.1% |
| Dutch | 17.6 /100 | #208 | Poor 45.0% |
| Immigrants | Costa Rica | 16.7 /100 | #209 | Poor 45.0% |
| Immigrants | Philippines | 16.7 /100 | #210 | Poor 45.0% |
| Immigrants | Zaire | 16.6 /100 | #211 | Poor 45.0% |
| French Canadians | 15.0 /100 | #212 | Poor 44.9% |
| Immigrants | Ghana | 14.2 /100 | #213 | Poor 44.8% |
| Immigrants | Middle Africa | 12.7 /100 | #214 | Poor 44.7% |
| Immigrants | Panama | 12.4 /100 | #215 | Poor 44.7% |
| Immigrants | Nigeria | 11.4 /100 | #216 | Poor 44.6% |
| Immigrants | Immigrants | 10.5 /100 | #217 | Poor 44.5% |