Choctaw vs Osage Associate's Degree
COMPARE
Choctaw
Osage
Associate's Degree
Associate's Degree Comparison
Choctaw
Osage
37.8%
ASSOCIATE'S DEGREE
0.0/ 100
METRIC RATING
312th/ 347
METRIC RANK
41.5%
ASSOCIATE'S DEGREE
0.3/ 100
METRIC RATING
264th/ 347
METRIC RANK
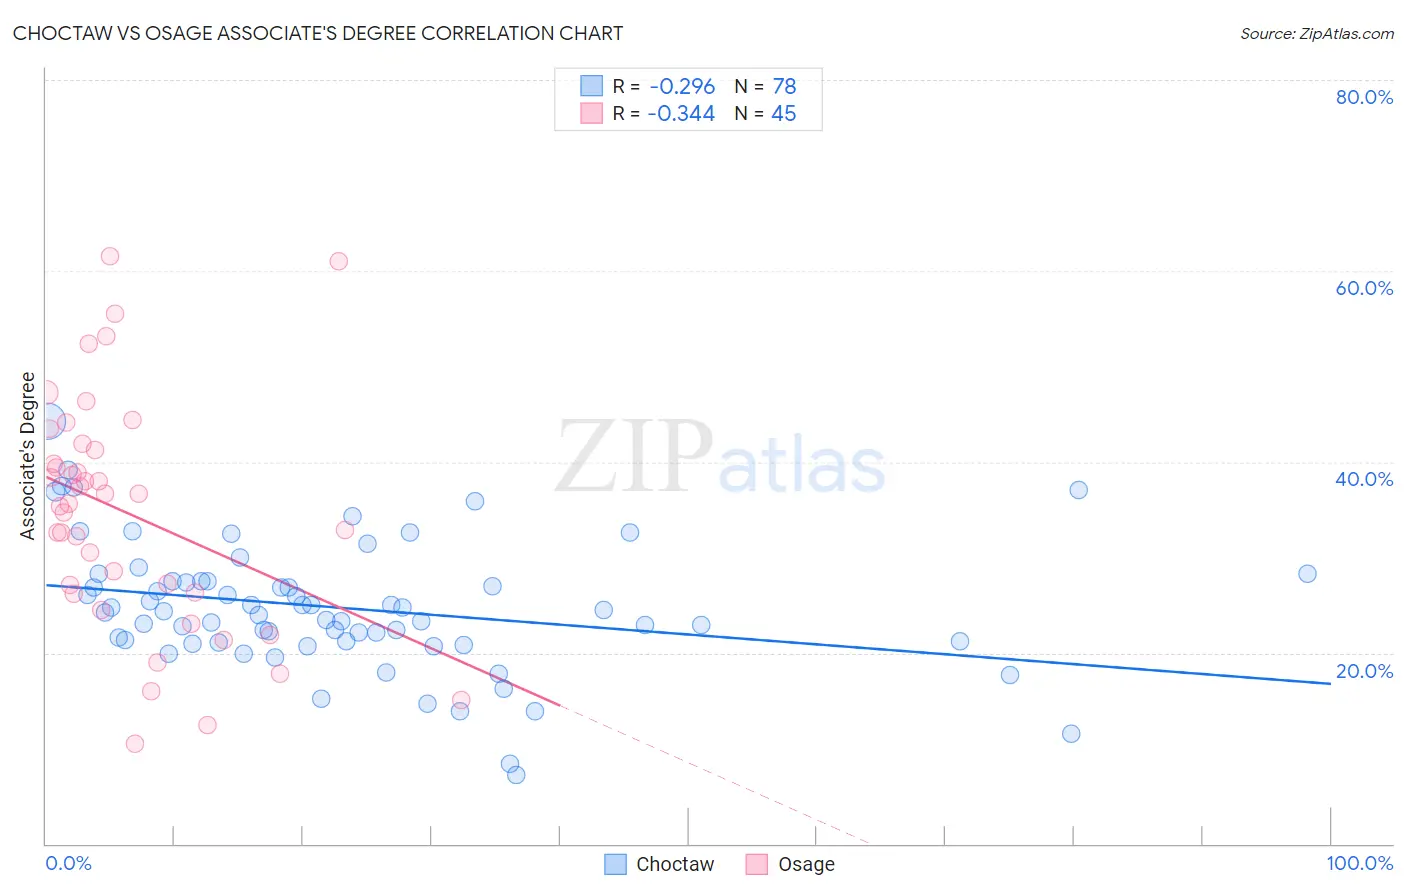
Choctaw vs Osage Associate's Degree Correlation Chart
The statistical analysis conducted on geographies consisting of 269,730,992 people shows a weak negative correlation between the proportion of Choctaw and percentage of population with at least associate's degree education in the United States with a correlation coefficient (R) of -0.296 and weighted average of 37.8%. Similarly, the statistical analysis conducted on geographies consisting of 91,808,929 people shows a mild negative correlation between the proportion of Osage and percentage of population with at least associate's degree education in the United States with a correlation coefficient (R) of -0.344 and weighted average of 41.5%, a difference of 9.7%.
Associate's Degree Correlation Summary
| Measurement | Choctaw | Osage |
| Minimum | 7.1% | 10.4% |
| Maximum | 44.2% | 61.5% |
| Range | 37.1% | 51.1% |
| Mean | 24.7% | 34.6% |
| Median | 24.3% | 35.6% |
| Interquartile 25% (IQ1) | 21.2% | 26.3% |
| Interquartile 75% (IQ3) | 27.5% | 41.5% |
| Interquartile Range (IQR) | 6.3% | 15.3% |
| Standard Deviation (Sample) | 6.8% | 12.2% |
| Standard Deviation (Population) | 6.8% | 12.1% |
Similar Demographics by Associate's Degree
Demographics Similar to Choctaw by Associate's Degree
In terms of associate's degree, the demographic groups most similar to Choctaw are Hispanic or Latino (37.7%, a difference of 0.15%), Seminole (37.7%, a difference of 0.20%), Immigrants from Latin America (37.9%, a difference of 0.22%), Immigrants from Dominican Republic (37.9%, a difference of 0.33%), and Creek (37.6%, a difference of 0.59%).
| Demographics | Rating | Rank | Associate's Degree |
| Immigrants | Honduras | 0.0 /100 | #305 | Tragic 38.5% |
| Shoshone | 0.0 /100 | #306 | Tragic 38.4% |
| Immigrants | El Salvador | 0.0 /100 | #307 | Tragic 38.4% |
| Mexican American Indians | 0.0 /100 | #308 | Tragic 38.2% |
| Immigrants | Guatemala | 0.0 /100 | #309 | Tragic 38.1% |
| Immigrants | Dominican Republic | 0.0 /100 | #310 | Tragic 37.9% |
| Immigrants | Latin America | 0.0 /100 | #311 | Tragic 37.9% |
| Choctaw | 0.0 /100 | #312 | Tragic 37.8% |
| Hispanics or Latinos | 0.0 /100 | #313 | Tragic 37.7% |
| Seminole | 0.0 /100 | #314 | Tragic 37.7% |
| Creek | 0.0 /100 | #315 | Tragic 37.6% |
| Crow | 0.0 /100 | #316 | Tragic 37.6% |
| Yaqui | 0.0 /100 | #317 | Tragic 37.6% |
| Alaska Natives | 0.0 /100 | #318 | Tragic 37.5% |
| Fijians | 0.0 /100 | #319 | Tragic 37.4% |
Demographics Similar to Osage by Associate's Degree
In terms of associate's degree, the demographic groups most similar to Osage are Immigrants from Jamaica (41.5%, a difference of 0.010%), Bahamian (41.5%, a difference of 0.030%), Nicaraguan (41.5%, a difference of 0.12%), Marshallese (41.6%, a difference of 0.25%), and Malaysian (41.6%, a difference of 0.44%).
| Demographics | Rating | Rank | Associate's Degree |
| Spanish Americans | 0.5 /100 | #257 | Tragic 41.8% |
| Japanese | 0.5 /100 | #258 | Tragic 41.7% |
| Malaysians | 0.4 /100 | #259 | Tragic 41.6% |
| Marshallese | 0.4 /100 | #260 | Tragic 41.6% |
| Nicaraguans | 0.4 /100 | #261 | Tragic 41.5% |
| Bahamians | 0.4 /100 | #262 | Tragic 41.5% |
| Immigrants | Jamaica | 0.3 /100 | #263 | Tragic 41.5% |
| Osage | 0.3 /100 | #264 | Tragic 41.5% |
| Africans | 0.2 /100 | #265 | Tragic 41.1% |
| Samoans | 0.2 /100 | #266 | Tragic 41.1% |
| Hawaiians | 0.2 /100 | #267 | Tragic 40.9% |
| Central American Indians | 0.2 /100 | #268 | Tragic 40.8% |
| Americans | 0.2 /100 | #269 | Tragic 40.8% |
| Chippewa | 0.2 /100 | #270 | Tragic 40.7% |
| Immigrants | Laos | 0.1 /100 | #271 | Tragic 40.7% |