Choctaw vs Mongolian 7th Grade
COMPARE
Choctaw
Mongolian
7th Grade
7th Grade Comparison
Choctaw
Mongolians
96.5%
7TH GRADE
96.6/ 100
METRIC RATING
115th/ 347
METRIC RANK
96.0%
7TH GRADE
50.0/ 100
METRIC RATING
174th/ 347
METRIC RANK
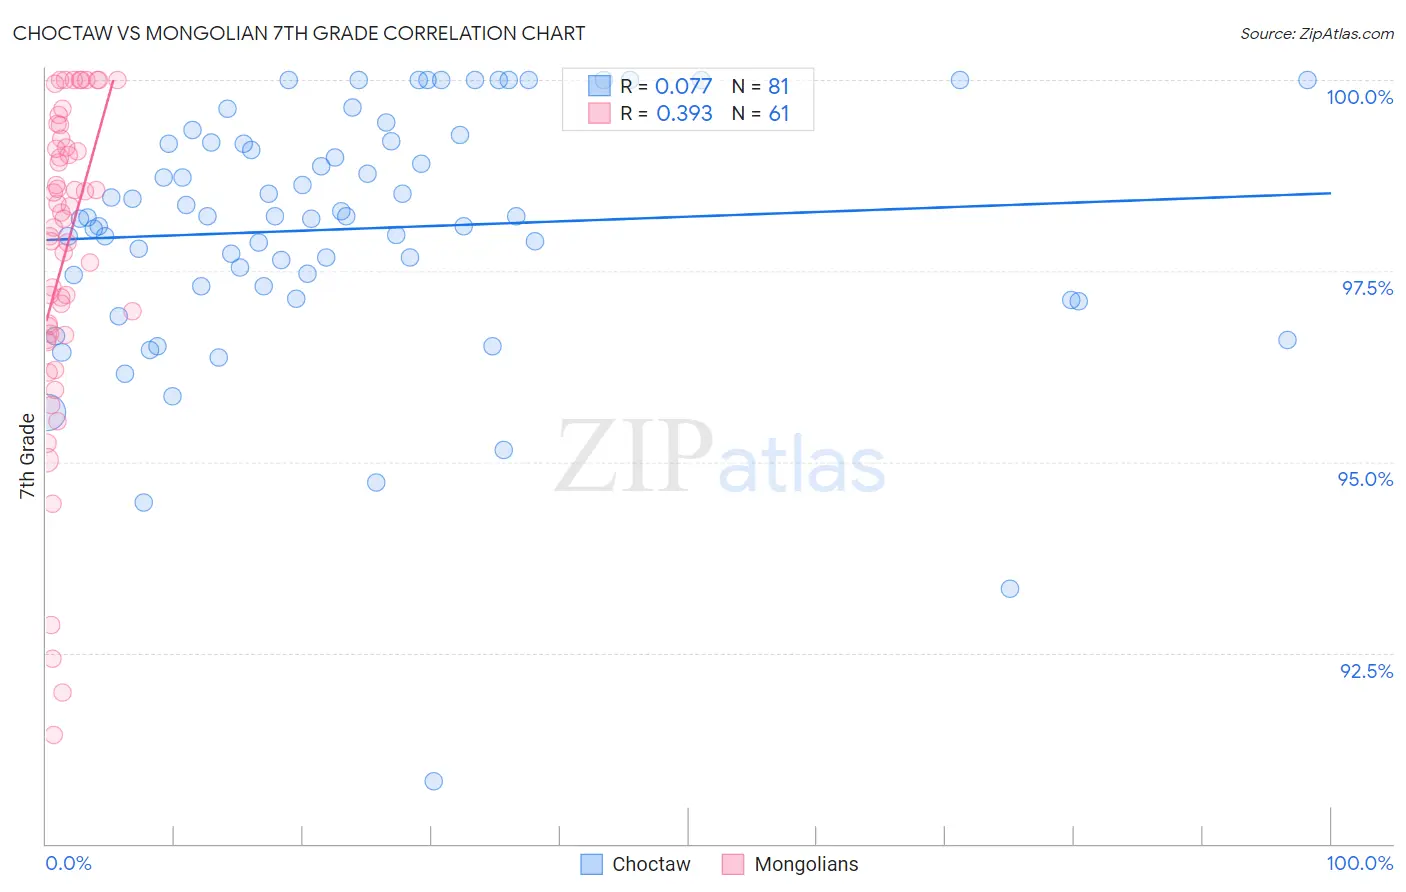
Choctaw vs Mongolian 7th Grade Correlation Chart
The statistical analysis conducted on geographies consisting of 269,742,875 people shows a slight positive correlation between the proportion of Choctaw and percentage of population with at least 7th grade education in the United States with a correlation coefficient (R) of 0.077 and weighted average of 96.5%. Similarly, the statistical analysis conducted on geographies consisting of 140,362,004 people shows a mild positive correlation between the proportion of Mongolians and percentage of population with at least 7th grade education in the United States with a correlation coefficient (R) of 0.393 and weighted average of 96.0%, a difference of 0.51%.
7th Grade Correlation Summary
| Measurement | Choctaw | Mongolian |
| Minimum | 90.8% | 91.4% |
| Maximum | 100.0% | 100.0% |
| Range | 9.2% | 8.6% |
| Mean | 98.1% | 97.7% |
| Median | 98.2% | 98.2% |
| Interquartile 25% (IQ1) | 97.3% | 96.7% |
| Interquartile 75% (IQ3) | 99.2% | 99.2% |
| Interquartile Range (IQR) | 1.9% | 2.5% |
| Standard Deviation (Sample) | 1.7% | 2.1% |
| Standard Deviation (Population) | 1.6% | 2.0% |
Similar Demographics by 7th Grade
Demographics Similar to Choctaw by 7th Grade
In terms of 7th grade, the demographic groups most similar to Choctaw are Immigrants from Zimbabwe (96.5%, a difference of 0.0%), Syrian (96.5%, a difference of 0.0%), Pueblo (96.5%, a difference of 0.010%), Nonimmigrants (96.5%, a difference of 0.020%), and Okinawan (96.6%, a difference of 0.040%).
| Demographics | Rating | Rank | 7th Grade |
| Immigrants | Saudi Arabia | 97.8 /100 | #108 | Exceptional 96.6% |
| Bhutanese | 97.7 /100 | #109 | Exceptional 96.6% |
| Okinawans | 97.4 /100 | #110 | Exceptional 96.6% |
| Immigrants | Latvia | 97.4 /100 | #111 | Exceptional 96.6% |
| Immigrants | Nonimmigrants | 97.0 /100 | #112 | Exceptional 96.5% |
| Pueblo | 96.8 /100 | #113 | Exceptional 96.5% |
| Immigrants | Zimbabwe | 96.6 /100 | #114 | Exceptional 96.5% |
| Choctaw | 96.6 /100 | #115 | Exceptional 96.5% |
| Syrians | 96.6 /100 | #116 | Exceptional 96.5% |
| Immigrants | Moldova | 95.7 /100 | #117 | Exceptional 96.5% |
| Immigrants | Japan | 95.5 /100 | #118 | Exceptional 96.5% |
| Immigrants | Norway | 95.2 /100 | #119 | Exceptional 96.5% |
| Immigrants | Croatia | 95.0 /100 | #120 | Exceptional 96.5% |
| Cheyenne | 94.9 /100 | #121 | Exceptional 96.5% |
| Immigrants | Europe | 94.8 /100 | #122 | Exceptional 96.5% |
Demographics Similar to Mongolians by 7th Grade
In terms of 7th grade, the demographic groups most similar to Mongolians are Immigrants from Albania (96.0%, a difference of 0.0%), Black/African American (96.0%, a difference of 0.0%), Chilean (96.0%, a difference of 0.0%), Venezuelan (96.0%, a difference of 0.010%), and Immigrants from Korea (96.0%, a difference of 0.010%).
| Demographics | Rating | Rank | 7th Grade |
| Immigrants | Sri Lanka | 59.9 /100 | #167 | Average 96.1% |
| Immigrants | Poland | 59.0 /100 | #168 | Average 96.1% |
| Ute | 55.8 /100 | #169 | Average 96.1% |
| Immigrants | Ukraine | 55.0 /100 | #170 | Average 96.1% |
| Egyptians | 54.2 /100 | #171 | Average 96.1% |
| Venezuelans | 51.4 /100 | #172 | Average 96.0% |
| Immigrants | Albania | 50.4 /100 | #173 | Average 96.0% |
| Mongolians | 50.0 /100 | #174 | Average 96.0% |
| Blacks/African Americans | 49.5 /100 | #175 | Average 96.0% |
| Chileans | 49.3 /100 | #176 | Average 96.0% |
| Immigrants | Korea | 49.2 /100 | #177 | Average 96.0% |
| Marshallese | 48.4 /100 | #178 | Average 96.0% |
| Immigrants | Iran | 47.8 /100 | #179 | Average 96.0% |
| Immigrants | Brazil | 46.8 /100 | #180 | Average 96.0% |
| Pakistanis | 44.5 /100 | #181 | Average 96.0% |