Choctaw vs Immigrants from Congo 7th Grade
COMPARE
Choctaw
Immigrants from Congo
7th Grade
7th Grade Comparison
Choctaw
Immigrants from Congo
96.5%
7TH GRADE
96.6/ 100
METRIC RATING
115th/ 347
METRIC RANK
95.3%
7TH GRADE
0.7/ 100
METRIC RATING
257th/ 347
METRIC RANK
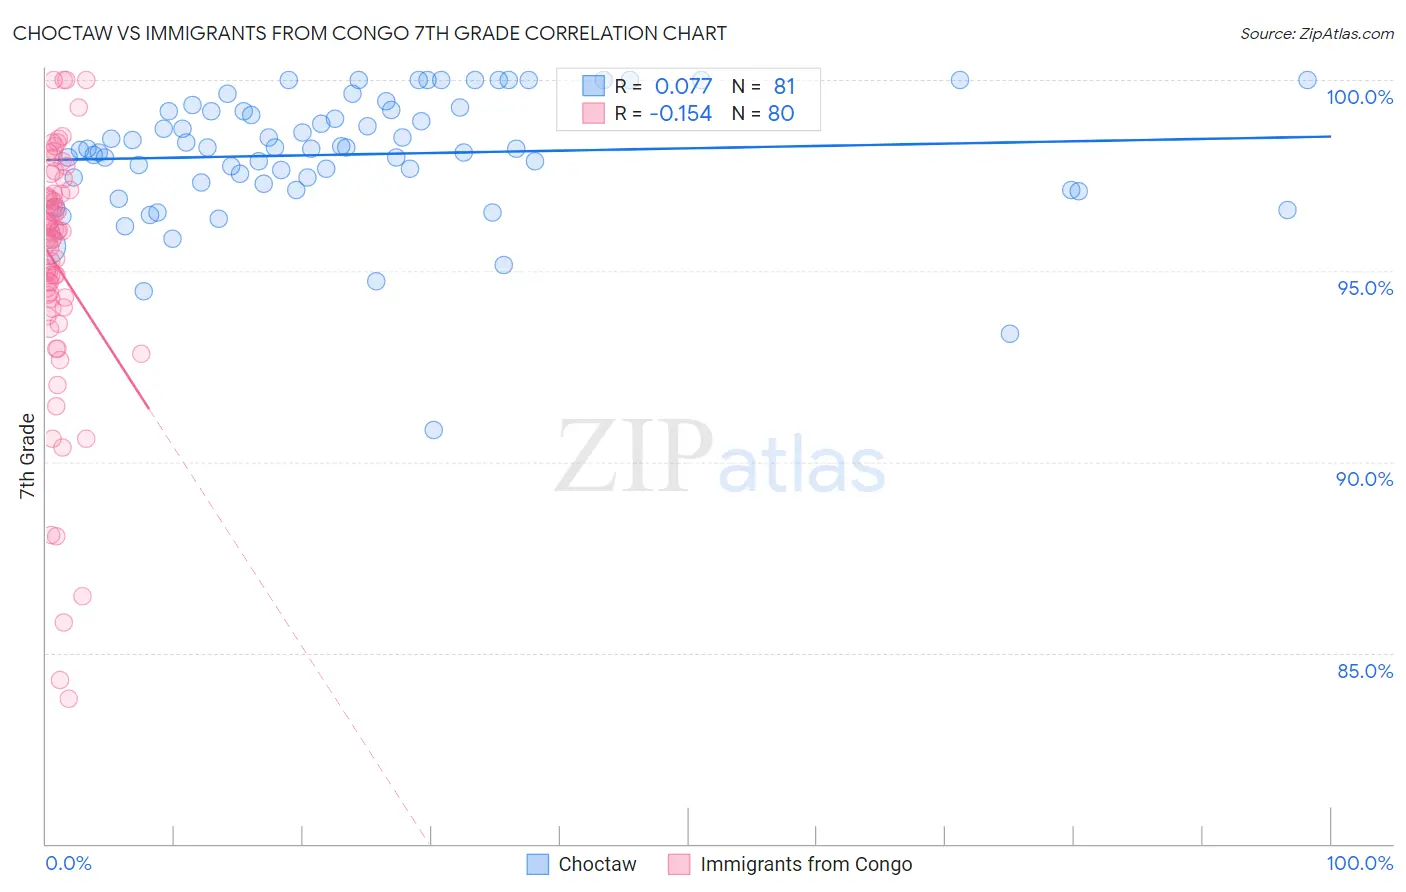
Choctaw vs Immigrants from Congo 7th Grade Correlation Chart
The statistical analysis conducted on geographies consisting of 269,742,875 people shows a slight positive correlation between the proportion of Choctaw and percentage of population with at least 7th grade education in the United States with a correlation coefficient (R) of 0.077 and weighted average of 96.5%. Similarly, the statistical analysis conducted on geographies consisting of 92,124,753 people shows a poor negative correlation between the proportion of Immigrants from Congo and percentage of population with at least 7th grade education in the United States with a correlation coefficient (R) of -0.154 and weighted average of 95.3%, a difference of 1.3%.
7th Grade Correlation Summary
| Measurement | Choctaw | Immigrants from Congo |
| Minimum | 90.8% | 83.8% |
| Maximum | 100.0% | 100.0% |
| Range | 9.2% | 16.2% |
| Mean | 98.1% | 95.1% |
| Median | 98.2% | 95.9% |
| Interquartile 25% (IQ1) | 97.3% | 94.2% |
| Interquartile 75% (IQ3) | 99.2% | 97.0% |
| Interquartile Range (IQR) | 1.9% | 2.9% |
| Standard Deviation (Sample) | 1.7% | 3.4% |
| Standard Deviation (Population) | 1.6% | 3.4% |
Similar Demographics by 7th Grade
Demographics Similar to Choctaw by 7th Grade
In terms of 7th grade, the demographic groups most similar to Choctaw are Immigrants from Zimbabwe (96.5%, a difference of 0.0%), Syrian (96.5%, a difference of 0.0%), Pueblo (96.5%, a difference of 0.010%), Nonimmigrants (96.5%, a difference of 0.020%), and Okinawan (96.6%, a difference of 0.040%).
| Demographics | Rating | Rank | 7th Grade |
| Immigrants | Saudi Arabia | 97.8 /100 | #108 | Exceptional 96.6% |
| Bhutanese | 97.7 /100 | #109 | Exceptional 96.6% |
| Okinawans | 97.4 /100 | #110 | Exceptional 96.6% |
| Immigrants | Latvia | 97.4 /100 | #111 | Exceptional 96.6% |
| Immigrants | Nonimmigrants | 97.0 /100 | #112 | Exceptional 96.5% |
| Pueblo | 96.8 /100 | #113 | Exceptional 96.5% |
| Immigrants | Zimbabwe | 96.6 /100 | #114 | Exceptional 96.5% |
| Choctaw | 96.6 /100 | #115 | Exceptional 96.5% |
| Syrians | 96.6 /100 | #116 | Exceptional 96.5% |
| Immigrants | Moldova | 95.7 /100 | #117 | Exceptional 96.5% |
| Immigrants | Japan | 95.5 /100 | #118 | Exceptional 96.5% |
| Immigrants | Norway | 95.2 /100 | #119 | Exceptional 96.5% |
| Immigrants | Croatia | 95.0 /100 | #120 | Exceptional 96.5% |
| Cheyenne | 94.9 /100 | #121 | Exceptional 96.5% |
| Immigrants | Europe | 94.8 /100 | #122 | Exceptional 96.5% |
Demographics Similar to Immigrants from Congo by 7th Grade
In terms of 7th grade, the demographic groups most similar to Immigrants from Congo are Immigrants from China (95.3%, a difference of 0.0%), Ghanaian (95.3%, a difference of 0.0%), Korean (95.3%, a difference of 0.010%), Colombian (95.3%, a difference of 0.020%), and Somali (95.3%, a difference of 0.030%).
| Demographics | Rating | Rank | 7th Grade |
| Immigrants | Cameroon | 0.9 /100 | #250 | Tragic 95.4% |
| Immigrants | Jamaica | 0.9 /100 | #251 | Tragic 95.4% |
| Immigrants | Ethiopia | 0.9 /100 | #252 | Tragic 95.3% |
| Somalis | 0.9 /100 | #253 | Tragic 95.3% |
| Colombians | 0.8 /100 | #254 | Tragic 95.3% |
| Koreans | 0.8 /100 | #255 | Tragic 95.3% |
| Immigrants | China | 0.7 /100 | #256 | Tragic 95.3% |
| Immigrants | Congo | 0.7 /100 | #257 | Tragic 95.3% |
| Ghanaians | 0.7 /100 | #258 | Tragic 95.3% |
| Immigrants | Costa Rica | 0.6 /100 | #259 | Tragic 95.3% |
| Afghans | 0.5 /100 | #260 | Tragic 95.3% |
| South Americans | 0.5 /100 | #261 | Tragic 95.2% |
| Immigrants | Somalia | 0.5 /100 | #262 | Tragic 95.2% |
| West Indians | 0.5 /100 | #263 | Tragic 95.2% |
| Immigrants | Nigeria | 0.4 /100 | #264 | Tragic 95.2% |