Paraguayan vs Immigrants from Barbados 7th Grade
COMPARE
Paraguayan
Immigrants from Barbados
7th Grade
7th Grade Comparison
Paraguayans
Immigrants from Barbados
95.9%
7TH GRADE
24.8/ 100
METRIC RATING
198th/ 347
METRIC RANK
95.0%
7TH GRADE
0.1/ 100
METRIC RATING
283rd/ 347
METRIC RANK
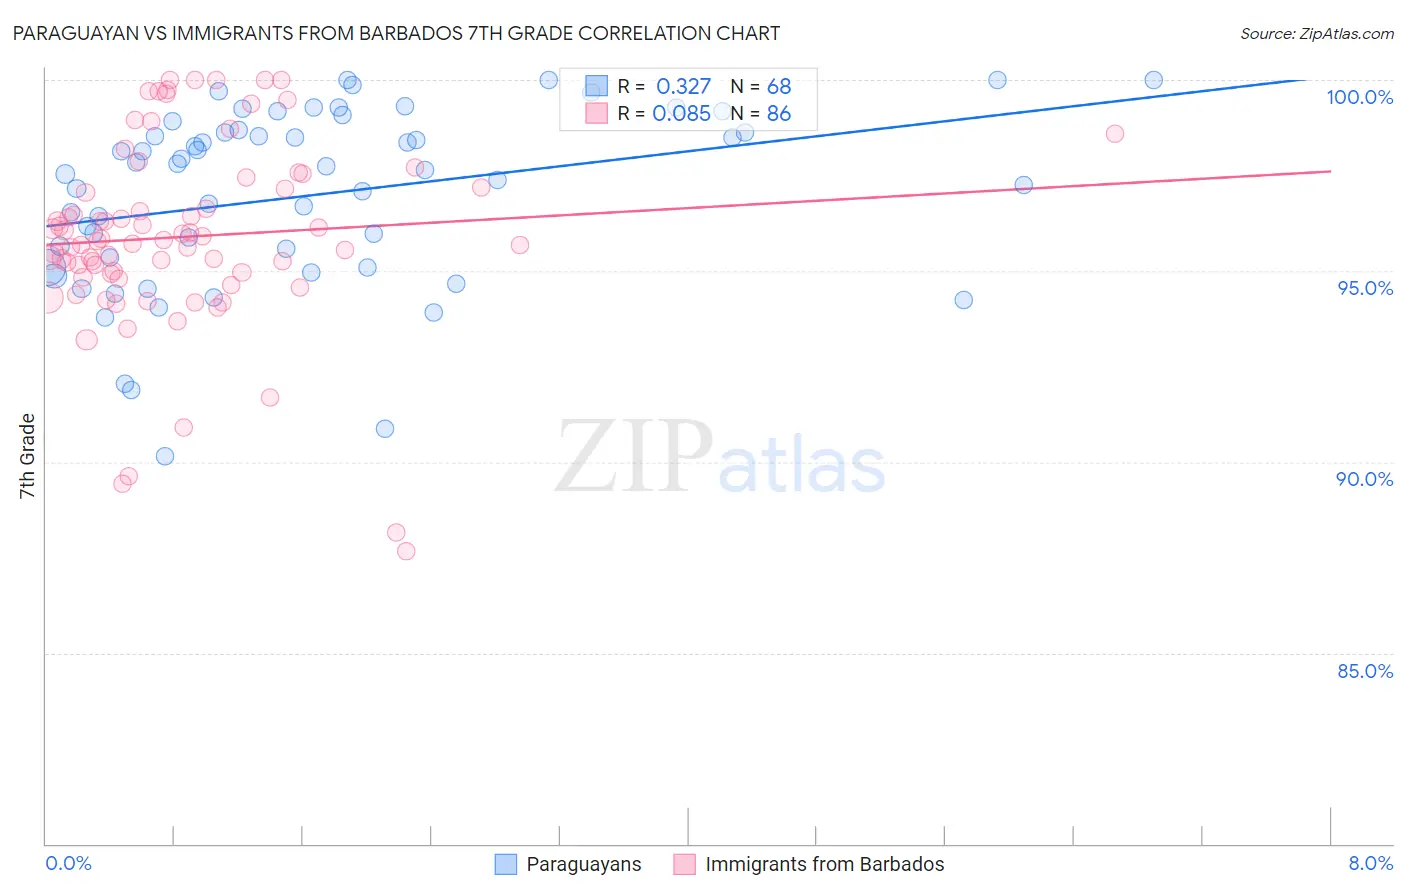
Paraguayan vs Immigrants from Barbados 7th Grade Correlation Chart
The statistical analysis conducted on geographies consisting of 95,115,093 people shows a mild positive correlation between the proportion of Paraguayans and percentage of population with at least 7th grade education in the United States with a correlation coefficient (R) of 0.327 and weighted average of 95.9%. Similarly, the statistical analysis conducted on geographies consisting of 112,787,165 people shows a slight positive correlation between the proportion of Immigrants from Barbados and percentage of population with at least 7th grade education in the United States with a correlation coefficient (R) of 0.085 and weighted average of 95.0%, a difference of 0.97%.
7th Grade Correlation Summary
| Measurement | Paraguayan | Immigrants from Barbados |
| Minimum | 90.2% | 87.6% |
| Maximum | 100.0% | 100.0% |
| Range | 9.8% | 12.4% |
| Mean | 97.0% | 95.9% |
| Median | 97.7% | 95.8% |
| Interquartile 25% (IQ1) | 95.2% | 94.9% |
| Interquartile 75% (IQ3) | 98.7% | 97.2% |
| Interquartile Range (IQR) | 3.4% | 2.3% |
| Standard Deviation (Sample) | 2.3% | 2.5% |
| Standard Deviation (Population) | 2.3% | 2.5% |
Similar Demographics by 7th Grade
Demographics Similar to Paraguayans by 7th Grade
In terms of 7th grade, the demographic groups most similar to Paraguayans are Guamanian/Chamorro (95.9%, a difference of 0.010%), Argentinean (95.9%, a difference of 0.010%), Apache (95.9%, a difference of 0.020%), Immigrants from Zaire (95.9%, a difference of 0.020%), and Immigrants from Argentina (95.9%, a difference of 0.020%).
| Demographics | Rating | Rank | 7th Grade |
| Liberians | 32.5 /100 | #191 | Fair 95.9% |
| Panamanians | 32.3 /100 | #192 | Fair 95.9% |
| Immigrants | Bahamas | 30.8 /100 | #193 | Fair 95.9% |
| Immigrants | Nepal | 30.0 /100 | #194 | Fair 95.9% |
| Sudanese | 28.1 /100 | #195 | Fair 95.9% |
| Apache | 27.6 /100 | #196 | Fair 95.9% |
| Immigrants | Zaire | 26.7 /100 | #197 | Fair 95.9% |
| Paraguayans | 24.8 /100 | #198 | Fair 95.9% |
| Guamanians/Chamorros | 23.5 /100 | #199 | Fair 95.9% |
| Argentineans | 23.2 /100 | #200 | Fair 95.9% |
| Immigrants | Argentina | 21.9 /100 | #201 | Fair 95.9% |
| Immigrants | Northern Africa | 21.4 /100 | #202 | Fair 95.8% |
| Comanche | 21.1 /100 | #203 | Fair 95.8% |
| Assyrians/Chaldeans/Syriacs | 20.5 /100 | #204 | Fair 95.8% |
| Moroccans | 18.9 /100 | #205 | Poor 95.8% |
Demographics Similar to Immigrants from Barbados by 7th Grade
In terms of 7th grade, the demographic groups most similar to Immigrants from Barbados are Armenian (95.0%, a difference of 0.0%), Immigrants from Eritrea (94.9%, a difference of 0.010%), Immigrants from Bolivia (95.0%, a difference of 0.060%), Immigrants from St. Vincent and the Grenadines (95.0%, a difference of 0.070%), and Tohono O'odham (95.0%, a difference of 0.070%).
| Demographics | Rating | Rank | 7th Grade |
| Immigrants | Thailand | 0.2 /100 | #276 | Tragic 95.1% |
| Immigrants | Afghanistan | 0.2 /100 | #277 | Tragic 95.1% |
| Immigrants | Trinidad and Tobago | 0.1 /100 | #278 | Tragic 95.1% |
| Barbadians | 0.1 /100 | #279 | Tragic 95.1% |
| Immigrants | St. Vincent and the Grenadines | 0.1 /100 | #280 | Tragic 95.0% |
| Tohono O'odham | 0.1 /100 | #281 | Tragic 95.0% |
| Immigrants | Bolivia | 0.1 /100 | #282 | Tragic 95.0% |
| Immigrants | Barbados | 0.1 /100 | #283 | Tragic 95.0% |
| Armenians | 0.1 /100 | #284 | Tragic 95.0% |
| Immigrants | Eritrea | 0.1 /100 | #285 | Tragic 94.9% |
| Immigrants | Philippines | 0.0 /100 | #286 | Tragic 94.9% |
| Immigrants | Peru | 0.0 /100 | #287 | Tragic 94.9% |
| British West Indians | 0.0 /100 | #288 | Tragic 94.8% |
| Taiwanese | 0.0 /100 | #289 | Tragic 94.8% |
| Malaysians | 0.0 /100 | #290 | Tragic 94.8% |