Chippewa vs Venezuelan Unemployment Among Ages 60 to 64 years
COMPARE
Chippewa
Venezuelan
Unemployment Among Ages 60 to 64 years
Unemployment Among Ages 60 to 64 years Comparison
Chippewa
Venezuelans
4.9%
UNEMPLOYMENT AMONG AGES 60 TO 64 YEARS
17.3/ 100
METRIC RATING
207th/ 347
METRIC RANK
4.5%
UNEMPLOYMENT AMONG AGES 60 TO 64 YEARS
100.0/ 100
METRIC RATING
36th/ 347
METRIC RANK
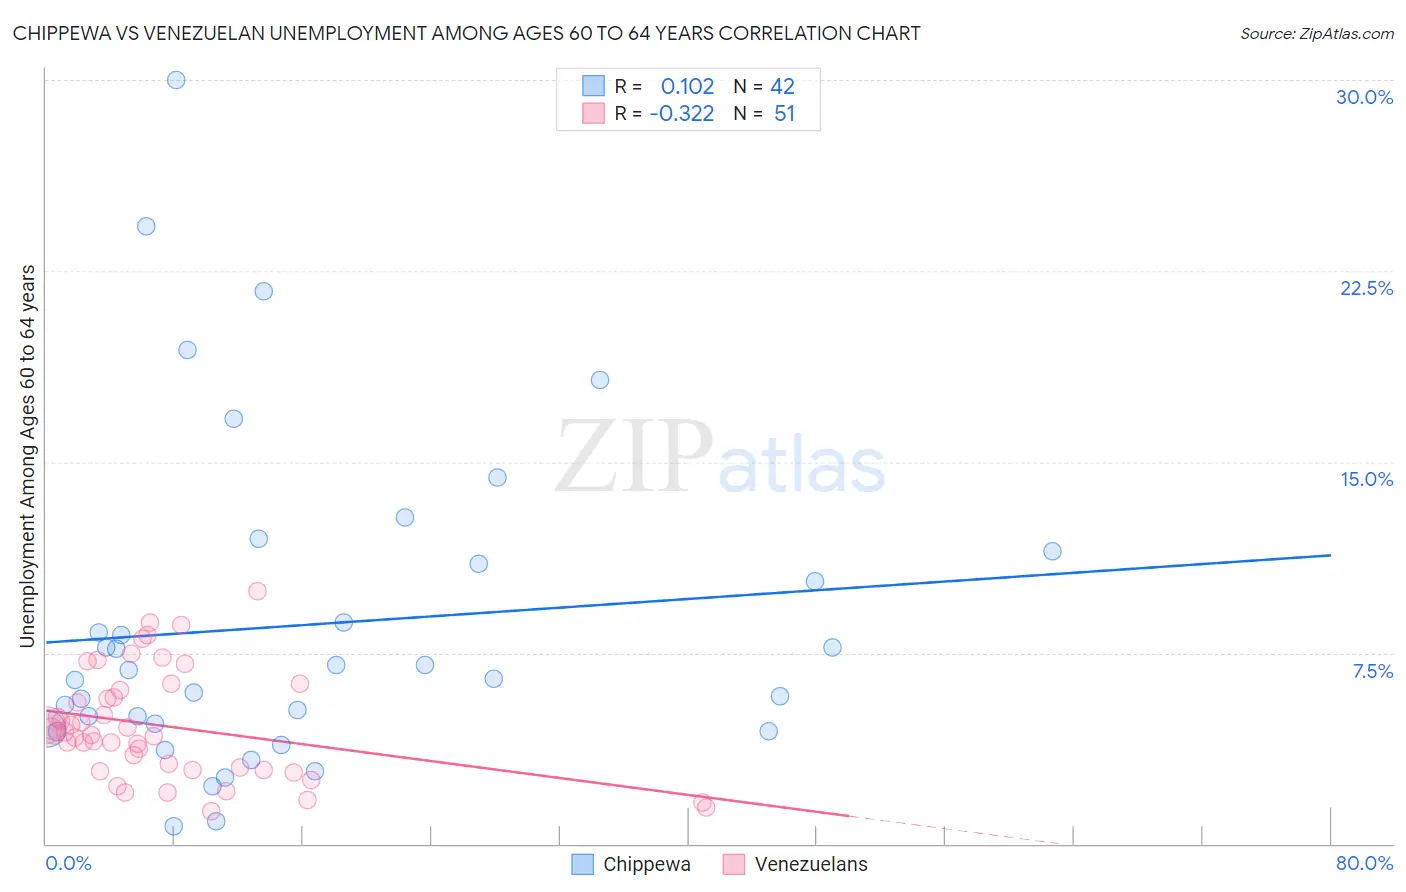
Chippewa vs Venezuelan Unemployment Among Ages 60 to 64 years Correlation Chart
The statistical analysis conducted on geographies consisting of 196,878,650 people shows a poor positive correlation between the proportion of Chippewa and unemployment rate among population between the ages 60 and 64 in the United States with a correlation coefficient (R) of 0.102 and weighted average of 4.9%. Similarly, the statistical analysis conducted on geographies consisting of 285,438,960 people shows a mild negative correlation between the proportion of Venezuelans and unemployment rate among population between the ages 60 and 64 in the United States with a correlation coefficient (R) of -0.322 and weighted average of 4.5%, a difference of 9.7%.
Unemployment Among Ages 60 to 64 years Correlation Summary
| Measurement | Chippewa | Venezuelan |
| Minimum | 0.70% | 1.3% |
| Maximum | 30.0% | 9.9% |
| Range | 29.3% | 8.6% |
| Mean | 8.6% | 4.6% |
| Median | 6.7% | 4.3% |
| Interquartile 25% (IQ1) | 4.5% | 2.9% |
| Interquartile 75% (IQ3) | 11.0% | 6.0% |
| Interquartile Range (IQR) | 6.5% | 3.1% |
| Standard Deviation (Sample) | 6.4% | 2.1% |
| Standard Deviation (Population) | 6.3% | 2.1% |
Similar Demographics by Unemployment Among Ages 60 to 64 years
Demographics Similar to Chippewa by Unemployment Among Ages 60 to 64 years
In terms of unemployment among ages 60 to 64 years, the demographic groups most similar to Chippewa are Immigrants from Indonesia (4.9%, a difference of 0.010%), New Zealander (4.9%, a difference of 0.010%), German Russian (4.9%, a difference of 0.030%), Sierra Leonean (4.9%, a difference of 0.050%), and Cherokee (4.9%, a difference of 0.070%).
| Demographics | Rating | Rank | Unemployment Among Ages 60 to 64 years |
| Immigrants | Czechoslovakia | 23.5 /100 | #200 | Fair 4.9% |
| Colombians | 22.7 /100 | #201 | Fair 4.9% |
| Immigrants | Western Africa | 20.6 /100 | #202 | Fair 4.9% |
| Uruguayans | 19.9 /100 | #203 | Poor 4.9% |
| Russians | 18.9 /100 | #204 | Poor 4.9% |
| Immigrants | Indonesia | 17.4 /100 | #205 | Poor 4.9% |
| New Zealanders | 17.4 /100 | #206 | Poor 4.9% |
| Chippewa | 17.3 /100 | #207 | Poor 4.9% |
| German Russians | 16.8 /100 | #208 | Poor 4.9% |
| Sierra Leoneans | 16.5 /100 | #209 | Poor 4.9% |
| Cherokee | 16.1 /100 | #210 | Poor 4.9% |
| Blackfeet | 15.7 /100 | #211 | Poor 4.9% |
| Moroccans | 15.0 /100 | #212 | Poor 4.9% |
| Eastern Europeans | 14.3 /100 | #213 | Poor 4.9% |
| Immigrants | Russia | 13.7 /100 | #214 | Poor 4.9% |
Demographics Similar to Venezuelans by Unemployment Among Ages 60 to 64 years
In terms of unemployment among ages 60 to 64 years, the demographic groups most similar to Venezuelans are German (4.5%, a difference of 0.010%), Belgian (4.5%, a difference of 0.030%), Immigrants from Portugal (4.5%, a difference of 0.030%), Native Hawaiian (4.5%, a difference of 0.23%), and Iraqi (4.5%, a difference of 0.23%).
| Demographics | Rating | Rank | Unemployment Among Ages 60 to 64 years |
| Cubans | 100.0 /100 | #29 | Exceptional 4.5% |
| Immigrants | Venezuela | 100.0 /100 | #30 | Exceptional 4.5% |
| Immigrants | Eritrea | 100.0 /100 | #31 | Exceptional 4.5% |
| Zimbabweans | 100.0 /100 | #32 | Exceptional 4.5% |
| Carpatho Rusyns | 100.0 /100 | #33 | Exceptional 4.5% |
| Belgians | 100.0 /100 | #34 | Exceptional 4.5% |
| Germans | 100.0 /100 | #35 | Exceptional 4.5% |
| Venezuelans | 100.0 /100 | #36 | Exceptional 4.5% |
| Immigrants | Portugal | 100.0 /100 | #37 | Exceptional 4.5% |
| Native Hawaiians | 100.0 /100 | #38 | Exceptional 4.5% |
| Iraqis | 100.0 /100 | #39 | Exceptional 4.5% |
| Scandinavians | 100.0 /100 | #40 | Exceptional 4.5% |
| Immigrants | Sudan | 100.0 /100 | #41 | Exceptional 4.5% |
| English | 100.0 /100 | #42 | Exceptional 4.5% |
| Swedes | 100.0 /100 | #43 | Exceptional 4.5% |