Dutch vs Venezuelan Master's Degree
COMPARE
Dutch
Venezuelan
Master's Degree
Master's Degree Comparison
Dutch
Venezuelans
13.8%
MASTER'S DEGREE
8.7/ 100
METRIC RATING
230th/ 347
METRIC RANK
15.9%
MASTER'S DEGREE
88.4/ 100
METRIC RATING
134th/ 347
METRIC RANK
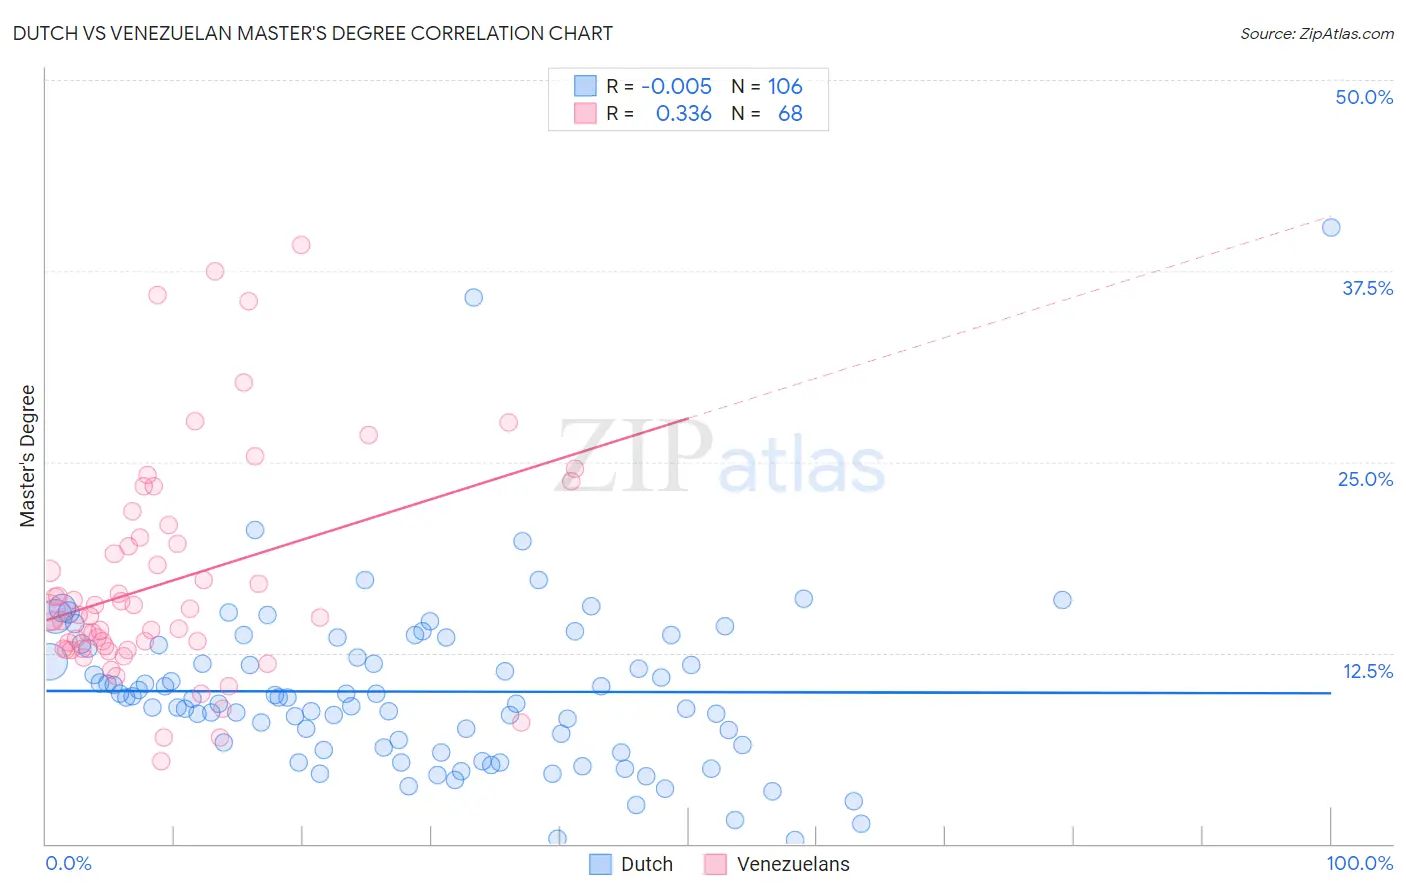
Dutch vs Venezuelan Master's Degree Correlation Chart
The statistical analysis conducted on geographies consisting of 553,710,662 people shows no correlation between the proportion of Dutch and percentage of population with at least master's degree education in the United States with a correlation coefficient (R) of -0.005 and weighted average of 13.8%. Similarly, the statistical analysis conducted on geographies consisting of 306,249,959 people shows a mild positive correlation between the proportion of Venezuelans and percentage of population with at least master's degree education in the United States with a correlation coefficient (R) of 0.336 and weighted average of 15.9%, a difference of 15.2%.
Master's Degree Correlation Summary
| Measurement | Dutch | Venezuelan |
| Minimum | 0.26% | 5.4% |
| Maximum | 40.4% | 39.2% |
| Range | 40.1% | 33.8% |
| Mean | 10.0% | 17.1% |
| Median | 9.5% | 14.9% |
| Interquartile 25% (IQ1) | 6.3% | 12.8% |
| Interquartile 75% (IQ3) | 12.8% | 19.8% |
| Interquartile Range (IQR) | 6.5% | 7.1% |
| Standard Deviation (Sample) | 5.7% | 7.2% |
| Standard Deviation (Population) | 5.7% | 7.2% |
Similar Demographics by Master's Degree
Demographics Similar to Dutch by Master's Degree
In terms of master's degree, the demographic groups most similar to Dutch are British West Indian (13.8%, a difference of 0.030%), White/Caucasian (13.8%, a difference of 0.14%), Immigrants from West Indies (13.9%, a difference of 0.45%), Guyanese (13.7%, a difference of 0.55%), and Immigrants from St. Vincent and the Grenadines (13.9%, a difference of 0.89%).
| Demographics | Rating | Rank | Master's Degree |
| Immigrants | South Eastern Asia | 11.9 /100 | #223 | Poor 14.0% |
| Immigrants | Grenada | 11.8 /100 | #224 | Poor 14.0% |
| Portuguese | 11.2 /100 | #225 | Poor 13.9% |
| Immigrants | St. Vincent and the Grenadines | 11.0 /100 | #226 | Poor 13.9% |
| Immigrants | West Indies | 9.8 /100 | #227 | Tragic 13.9% |
| Whites/Caucasians | 9.1 /100 | #228 | Tragic 13.8% |
| British West Indians | 8.8 /100 | #229 | Tragic 13.8% |
| Dutch | 8.7 /100 | #230 | Tragic 13.8% |
| Guyanese | 7.6 /100 | #231 | Tragic 13.7% |
| Immigrants | Philippines | 6.0 /100 | #232 | Tragic 13.6% |
| Immigrants | Ecuador | 5.7 /100 | #233 | Tragic 13.6% |
| Immigrants | Burma/Myanmar | 5.0 /100 | #234 | Tragic 13.5% |
| German Russians | 4.5 /100 | #235 | Tragic 13.5% |
| Immigrants | Guyana | 4.4 /100 | #236 | Tragic 13.4% |
| Jamaicans | 4.1 /100 | #237 | Tragic 13.4% |
Demographics Similar to Venezuelans by Master's Degree
In terms of master's degree, the demographic groups most similar to Venezuelans are South American Indian (15.9%, a difference of 0.0%), Assyrian/Chaldean/Syriac (15.8%, a difference of 0.45%), Immigrants from Sudan (16.0%, a difference of 0.56%), European (15.8%, a difference of 0.56%), and Pakistani (15.8%, a difference of 0.64%).
| Demographics | Rating | Rank | Master's Degree |
| Palestinians | 94.8 /100 | #127 | Exceptional 16.3% |
| Immigrants | Sierra Leone | 94.7 /100 | #128 | Exceptional 16.3% |
| Immigrants | Syria | 93.3 /100 | #129 | Exceptional 16.2% |
| Immigrants | Jordan | 92.7 /100 | #130 | Exceptional 16.1% |
| Taiwanese | 91.9 /100 | #131 | Exceptional 16.1% |
| Serbians | 91.7 /100 | #132 | Exceptional 16.1% |
| Immigrants | Sudan | 90.2 /100 | #133 | Exceptional 16.0% |
| Venezuelans | 88.4 /100 | #134 | Excellent 15.9% |
| South American Indians | 88.4 /100 | #135 | Excellent 15.9% |
| Assyrians/Chaldeans/Syriacs | 86.8 /100 | #136 | Excellent 15.8% |
| Europeans | 86.4 /100 | #137 | Excellent 15.8% |
| Pakistanis | 86.1 /100 | #138 | Excellent 15.8% |
| Immigrants | Germany | 85.9 /100 | #139 | Excellent 15.8% |
| Vietnamese | 85.5 /100 | #140 | Excellent 15.8% |
| Poles | 85.0 /100 | #141 | Excellent 15.7% |