Costa Rican vs Venezuelan Master's Degree
COMPARE
Costa Rican
Venezuelan
Master's Degree
Master's Degree Comparison
Costa Ricans
Venezuelans
15.0%
MASTER'S DEGREE
52.5/ 100
METRIC RATING
173rd/ 347
METRIC RANK
15.9%
MASTER'S DEGREE
88.4/ 100
METRIC RATING
134th/ 347
METRIC RANK
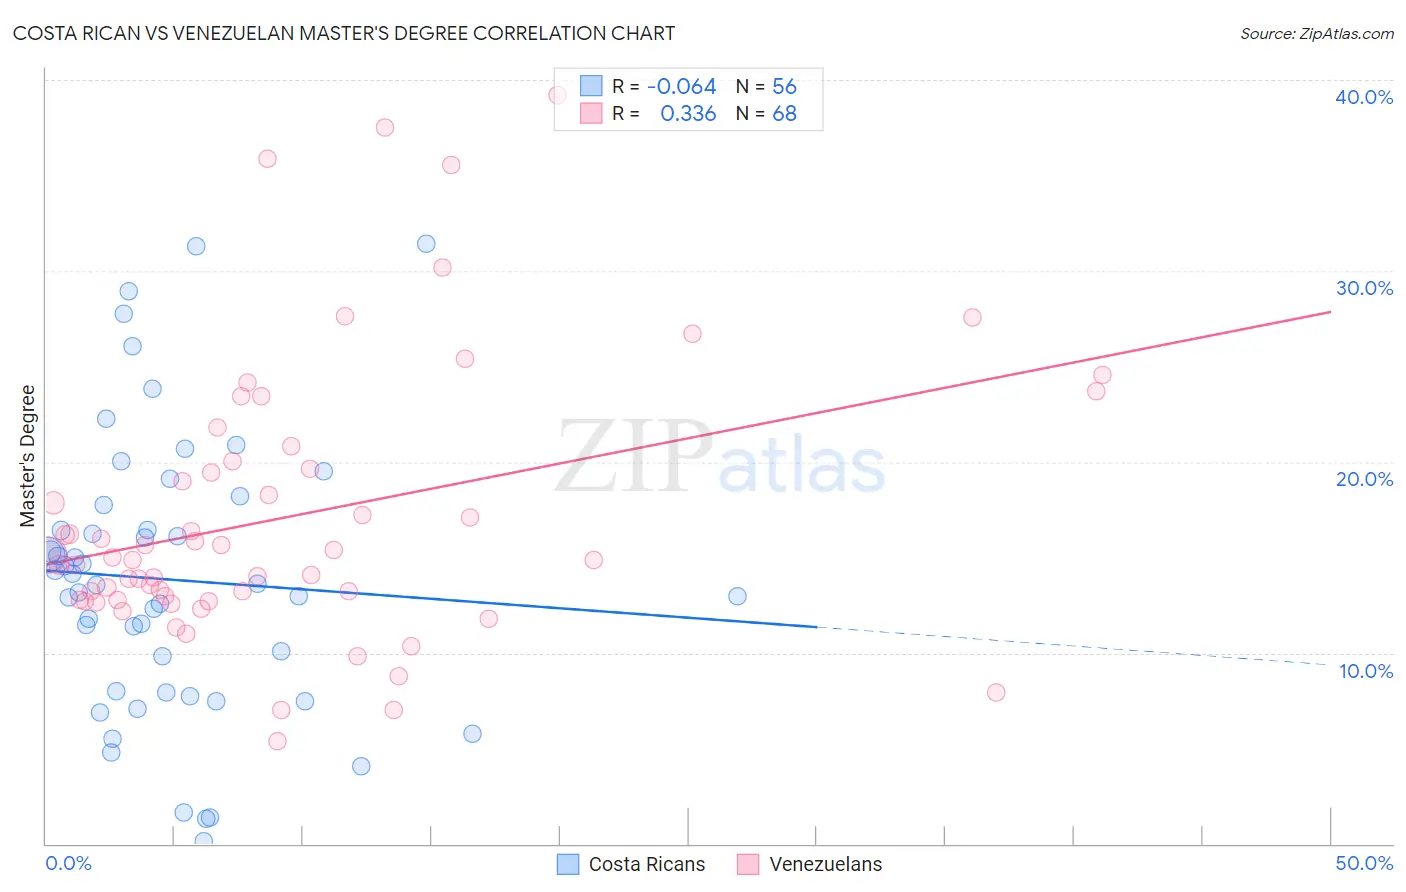
Costa Rican vs Venezuelan Master's Degree Correlation Chart
The statistical analysis conducted on geographies consisting of 253,588,178 people shows a slight negative correlation between the proportion of Costa Ricans and percentage of population with at least master's degree education in the United States with a correlation coefficient (R) of -0.064 and weighted average of 15.0%. Similarly, the statistical analysis conducted on geographies consisting of 306,249,959 people shows a mild positive correlation between the proportion of Venezuelans and percentage of population with at least master's degree education in the United States with a correlation coefficient (R) of 0.336 and weighted average of 15.9%, a difference of 6.2%.
Master's Degree Correlation Summary
| Measurement | Costa Rican | Venezuelan |
| Minimum | 0.13% | 5.4% |
| Maximum | 31.4% | 39.2% |
| Range | 31.3% | 33.8% |
| Mean | 13.8% | 17.1% |
| Median | 13.6% | 14.9% |
| Interquartile 25% (IQ1) | 8.0% | 12.8% |
| Interquartile 75% (IQ3) | 17.1% | 19.8% |
| Interquartile Range (IQR) | 9.1% | 7.1% |
| Standard Deviation (Sample) | 7.3% | 7.2% |
| Standard Deviation (Population) | 7.2% | 7.2% |
Similar Demographics by Master's Degree
Demographics Similar to Costa Ricans by Master's Degree
In terms of master's degree, the demographic groups most similar to Costa Ricans are Immigrants from Uruguay (15.0%, a difference of 0.040%), Immigrants from Ghana (15.0%, a difference of 0.14%), Slovak (14.9%, a difference of 0.32%), Immigrants from Peru (14.9%, a difference of 0.36%), and Irish (15.0%, a difference of 0.50%).
| Demographics | Rating | Rank | Master's Degree |
| Swedes | 66.1 /100 | #166 | Good 15.2% |
| Senegalese | 65.6 /100 | #167 | Good 15.2% |
| Immigrants | North Macedonia | 64.5 /100 | #168 | Good 15.2% |
| Scottish | 62.7 /100 | #169 | Good 15.2% |
| Irish | 56.3 /100 | #170 | Average 15.0% |
| Immigrants | Ghana | 53.6 /100 | #171 | Average 15.0% |
| Immigrants | Uruguay | 52.8 /100 | #172 | Average 15.0% |
| Costa Ricans | 52.5 /100 | #173 | Average 15.0% |
| Slovaks | 50.0 /100 | #174 | Average 14.9% |
| Immigrants | Peru | 49.6 /100 | #175 | Average 14.9% |
| Nigerians | 48.6 /100 | #176 | Average 14.9% |
| Immigrants | Colombia | 48.3 /100 | #177 | Average 14.9% |
| English | 45.0 /100 | #178 | Average 14.8% |
| Immigrants | Iraq | 41.3 /100 | #179 | Average 14.8% |
| Celtics | 41.3 /100 | #180 | Average 14.8% |
Demographics Similar to Venezuelans by Master's Degree
In terms of master's degree, the demographic groups most similar to Venezuelans are South American Indian (15.9%, a difference of 0.0%), Assyrian/Chaldean/Syriac (15.8%, a difference of 0.45%), Immigrants from Sudan (16.0%, a difference of 0.56%), European (15.8%, a difference of 0.56%), and Pakistani (15.8%, a difference of 0.64%).
| Demographics | Rating | Rank | Master's Degree |
| Palestinians | 94.8 /100 | #127 | Exceptional 16.3% |
| Immigrants | Sierra Leone | 94.7 /100 | #128 | Exceptional 16.3% |
| Immigrants | Syria | 93.3 /100 | #129 | Exceptional 16.2% |
| Immigrants | Jordan | 92.7 /100 | #130 | Exceptional 16.1% |
| Taiwanese | 91.9 /100 | #131 | Exceptional 16.1% |
| Serbians | 91.7 /100 | #132 | Exceptional 16.1% |
| Immigrants | Sudan | 90.2 /100 | #133 | Exceptional 16.0% |
| Venezuelans | 88.4 /100 | #134 | Excellent 15.9% |
| South American Indians | 88.4 /100 | #135 | Excellent 15.9% |
| Assyrians/Chaldeans/Syriacs | 86.8 /100 | #136 | Excellent 15.8% |
| Europeans | 86.4 /100 | #137 | Excellent 15.8% |
| Pakistanis | 86.1 /100 | #138 | Excellent 15.8% |
| Immigrants | Germany | 85.9 /100 | #139 | Excellent 15.8% |
| Vietnamese | 85.5 /100 | #140 | Excellent 15.8% |
| Poles | 85.0 /100 | #141 | Excellent 15.7% |