Immigrants from Western Europe vs Venezuelan Master's Degree
COMPARE
Immigrants from Western Europe
Venezuelan
Master's Degree
Master's Degree Comparison
Immigrants from Western Europe
Venezuelans
17.8%
MASTER'S DEGREE
99.8/ 100
METRIC RATING
70th/ 347
METRIC RANK
15.9%
MASTER'S DEGREE
88.4/ 100
METRIC RATING
134th/ 347
METRIC RANK
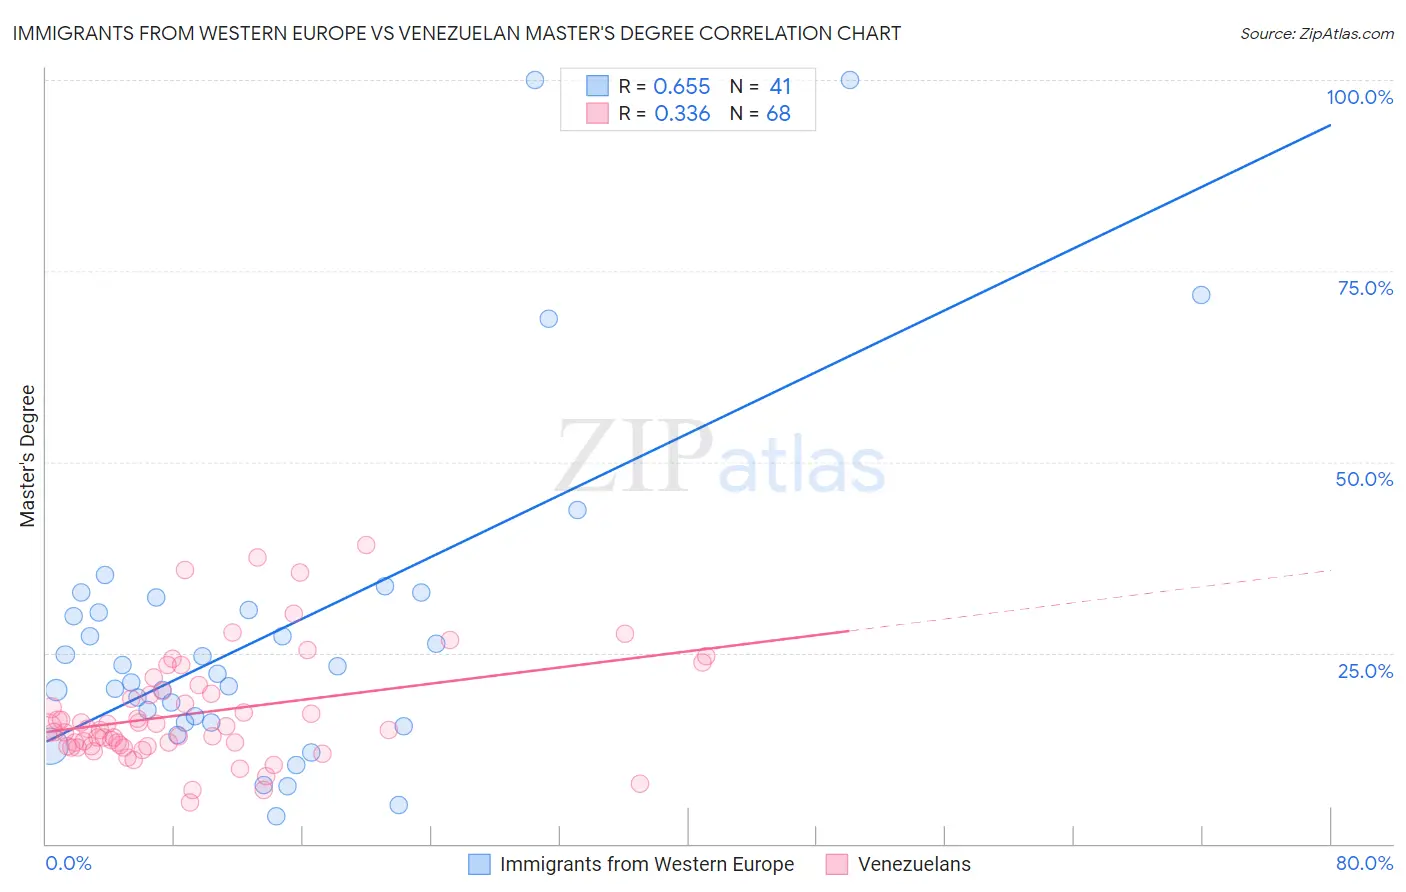
Immigrants from Western Europe vs Venezuelan Master's Degree Correlation Chart
The statistical analysis conducted on geographies consisting of 493,893,218 people shows a significant positive correlation between the proportion of Immigrants from Western Europe and percentage of population with at least master's degree education in the United States with a correlation coefficient (R) of 0.655 and weighted average of 17.8%. Similarly, the statistical analysis conducted on geographies consisting of 306,249,959 people shows a mild positive correlation between the proportion of Venezuelans and percentage of population with at least master's degree education in the United States with a correlation coefficient (R) of 0.336 and weighted average of 15.9%, a difference of 12.2%.
Master's Degree Correlation Summary
| Measurement | Immigrants from Western Europe | Venezuelan |
| Minimum | 3.7% | 5.4% |
| Maximum | 100.0% | 39.2% |
| Range | 96.3% | 33.8% |
| Mean | 27.7% | 17.1% |
| Median | 22.3% | 14.9% |
| Interquartile 25% (IQ1) | 15.8% | 12.8% |
| Interquartile 75% (IQ3) | 31.4% | 19.8% |
| Interquartile Range (IQR) | 15.5% | 7.1% |
| Standard Deviation (Sample) | 21.5% | 7.2% |
| Standard Deviation (Population) | 21.3% | 7.2% |
Similar Demographics by Master's Degree
Demographics Similar to Immigrants from Western Europe by Master's Degree
In terms of master's degree, the demographic groups most similar to Immigrants from Western Europe are Immigrants from Uzbekistan (17.9%, a difference of 0.22%), Immigrants from Pakistan (17.8%, a difference of 0.28%), Lithuanian (17.7%, a difference of 0.46%), Immigrants from Ethiopia (17.9%, a difference of 0.54%), and Zimbabwean (17.7%, a difference of 0.57%).
| Demographics | Rating | Rank | Master's Degree |
| Immigrants | Netherlands | 99.9 /100 | #63 | Exceptional 18.1% |
| South Africans | 99.9 /100 | #64 | Exceptional 18.1% |
| Immigrants | Kazakhstan | 99.8 /100 | #65 | Exceptional 18.0% |
| Ethiopians | 99.8 /100 | #66 | Exceptional 18.0% |
| Immigrants | Argentina | 99.8 /100 | #67 | Exceptional 18.0% |
| Immigrants | Ethiopia | 99.8 /100 | #68 | Exceptional 17.9% |
| Immigrants | Uzbekistan | 99.8 /100 | #69 | Exceptional 17.9% |
| Immigrants | Western Europe | 99.8 /100 | #70 | Exceptional 17.8% |
| Immigrants | Pakistan | 99.7 /100 | #71 | Exceptional 17.8% |
| Lithuanians | 99.7 /100 | #72 | Exceptional 17.7% |
| Zimbabweans | 99.7 /100 | #73 | Exceptional 17.7% |
| Immigrants | Romania | 99.7 /100 | #74 | Exceptional 17.7% |
| Egyptians | 99.6 /100 | #75 | Exceptional 17.6% |
| Immigrants | Indonesia | 99.6 /100 | #76 | Exceptional 17.6% |
| Immigrants | Eastern Europe | 99.6 /100 | #77 | Exceptional 17.6% |
Demographics Similar to Venezuelans by Master's Degree
In terms of master's degree, the demographic groups most similar to Venezuelans are South American Indian (15.9%, a difference of 0.0%), Assyrian/Chaldean/Syriac (15.8%, a difference of 0.45%), Immigrants from Sudan (16.0%, a difference of 0.56%), European (15.8%, a difference of 0.56%), and Pakistani (15.8%, a difference of 0.64%).
| Demographics | Rating | Rank | Master's Degree |
| Palestinians | 94.8 /100 | #127 | Exceptional 16.3% |
| Immigrants | Sierra Leone | 94.7 /100 | #128 | Exceptional 16.3% |
| Immigrants | Syria | 93.3 /100 | #129 | Exceptional 16.2% |
| Immigrants | Jordan | 92.7 /100 | #130 | Exceptional 16.1% |
| Taiwanese | 91.9 /100 | #131 | Exceptional 16.1% |
| Serbians | 91.7 /100 | #132 | Exceptional 16.1% |
| Immigrants | Sudan | 90.2 /100 | #133 | Exceptional 16.0% |
| Venezuelans | 88.4 /100 | #134 | Excellent 15.9% |
| South American Indians | 88.4 /100 | #135 | Excellent 15.9% |
| Assyrians/Chaldeans/Syriacs | 86.8 /100 | #136 | Excellent 15.8% |
| Europeans | 86.4 /100 | #137 | Excellent 15.8% |
| Pakistanis | 86.1 /100 | #138 | Excellent 15.8% |
| Immigrants | Germany | 85.9 /100 | #139 | Excellent 15.8% |
| Vietnamese | 85.5 /100 | #140 | Excellent 15.8% |
| Poles | 85.0 /100 | #141 | Excellent 15.7% |