Chippewa vs Venezuelan Single Father Households
COMPARE
Chippewa
Venezuelan
Single Father Households
Single Father Households Comparison
Chippewa
Venezuelans
3.1%
SINGLE FATHER HOUSEHOLDS
0.0/ 100
METRIC RATING
329th/ 347
METRIC RANK
2.3%
SINGLE FATHER HOUSEHOLDS
86.2/ 100
METRIC RATING
150th/ 347
METRIC RANK
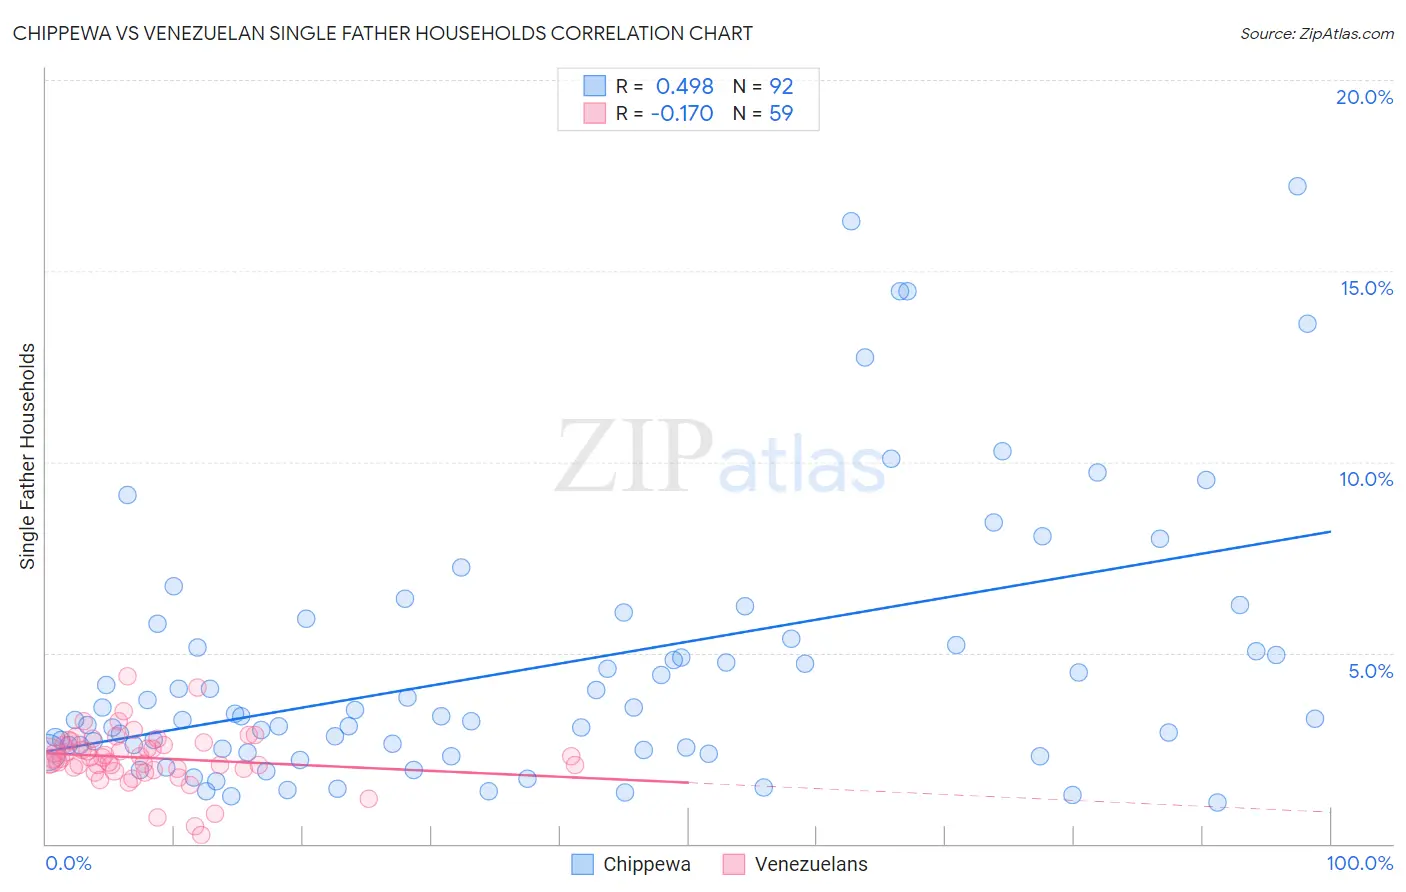
Chippewa vs Venezuelan Single Father Households Correlation Chart
The statistical analysis conducted on geographies consisting of 214,030,064 people shows a moderate positive correlation between the proportion of Chippewa and percentage of single father households in the United States with a correlation coefficient (R) of 0.498 and weighted average of 3.1%. Similarly, the statistical analysis conducted on geographies consisting of 304,547,521 people shows a poor negative correlation between the proportion of Venezuelans and percentage of single father households in the United States with a correlation coefficient (R) of -0.170 and weighted average of 2.3%, a difference of 36.8%.
Single Father Households Correlation Summary
| Measurement | Chippewa | Venezuelan |
| Minimum | 1.1% | 0.23% |
| Maximum | 17.2% | 4.4% |
| Range | 16.1% | 4.1% |
| Mean | 4.6% | 2.2% |
| Median | 3.3% | 2.2% |
| Interquartile 25% (IQ1) | 2.5% | 1.9% |
| Interquartile 75% (IQ3) | 5.3% | 2.7% |
| Interquartile Range (IQR) | 2.8% | 0.71% |
| Standard Deviation (Sample) | 3.5% | 0.73% |
| Standard Deviation (Population) | 3.5% | 0.72% |
Similar Demographics by Single Father Households
Demographics Similar to Chippewa by Single Father Households
In terms of single father households, the demographic groups most similar to Chippewa are Immigrants from Cabo Verde (3.1%, a difference of 0.10%), Bangladeshi (3.1%, a difference of 0.65%), Nepalese (3.1%, a difference of 0.88%), Aleut (3.0%, a difference of 1.5%), and Immigrants from Mexico (3.0%, a difference of 1.7%).
| Demographics | Rating | Rank | Single Father Households |
| Immigrants | Guatemala | 0.0 /100 | #322 | Tragic 3.0% |
| Immigrants | Central America | 0.0 /100 | #323 | Tragic 3.0% |
| Fijians | 0.0 /100 | #324 | Tragic 3.0% |
| Immigrants | Mexico | 0.0 /100 | #325 | Tragic 3.0% |
| Aleuts | 0.0 /100 | #326 | Tragic 3.0% |
| Bangladeshis | 0.0 /100 | #327 | Tragic 3.1% |
| Immigrants | Cabo Verde | 0.0 /100 | #328 | Tragic 3.1% |
| Chippewa | 0.0 /100 | #329 | Tragic 3.1% |
| Nepalese | 0.0 /100 | #330 | Tragic 3.1% |
| Navajo | 0.0 /100 | #331 | Tragic 3.2% |
| Yaqui | 0.0 /100 | #332 | Tragic 3.2% |
| Natives/Alaskans | 0.0 /100 | #333 | Tragic 3.2% |
| Yuman | 0.0 /100 | #334 | Tragic 3.3% |
| Colville | 0.0 /100 | #335 | Tragic 3.3% |
| Paiute | 0.0 /100 | #336 | Tragic 3.3% |
Demographics Similar to Venezuelans by Single Father Households
In terms of single father households, the demographic groups most similar to Venezuelans are Immigrants from Syria (2.3%, a difference of 0.21%), Senegalese (2.3%, a difference of 0.38%), South American Indian (2.3%, a difference of 0.39%), Immigrants from Venezuela (2.3%, a difference of 0.44%), and Slavic (2.2%, a difference of 0.49%).
| Demographics | Rating | Rank | Single Father Households |
| Immigrants | Nepal | 92.1 /100 | #143 | Exceptional 2.2% |
| Slovaks | 90.7 /100 | #144 | Exceptional 2.2% |
| Immigrants | Zimbabwe | 90.2 /100 | #145 | Exceptional 2.2% |
| Northern Europeans | 89.8 /100 | #146 | Excellent 2.2% |
| Slavs | 88.9 /100 | #147 | Excellent 2.2% |
| South American Indians | 88.5 /100 | #148 | Excellent 2.3% |
| Senegalese | 88.4 /100 | #149 | Excellent 2.3% |
| Venezuelans | 86.2 /100 | #150 | Excellent 2.3% |
| Immigrants | Syria | 84.8 /100 | #151 | Excellent 2.3% |
| Immigrants | Venezuela | 83.2 /100 | #152 | Excellent 2.3% |
| Immigrants | Germany | 82.8 /100 | #153 | Excellent 2.3% |
| Bolivians | 81.0 /100 | #154 | Excellent 2.3% |
| Europeans | 80.9 /100 | #155 | Excellent 2.3% |
| Immigrants | South America | 79.9 /100 | #156 | Good 2.3% |
| Canadians | 79.7 /100 | #157 | Good 2.3% |