Chippewa vs Colville Doctorate Degree
COMPARE
Chippewa
Colville
Doctorate Degree
Doctorate Degree Comparison
Chippewa
Colville
1.5%
DOCTORATE DEGREE
0.9/ 100
METRIC RATING
257th/ 347
METRIC RANK
1.6%
DOCTORATE DEGREE
4.7/ 100
METRIC RATING
229th/ 347
METRIC RANK
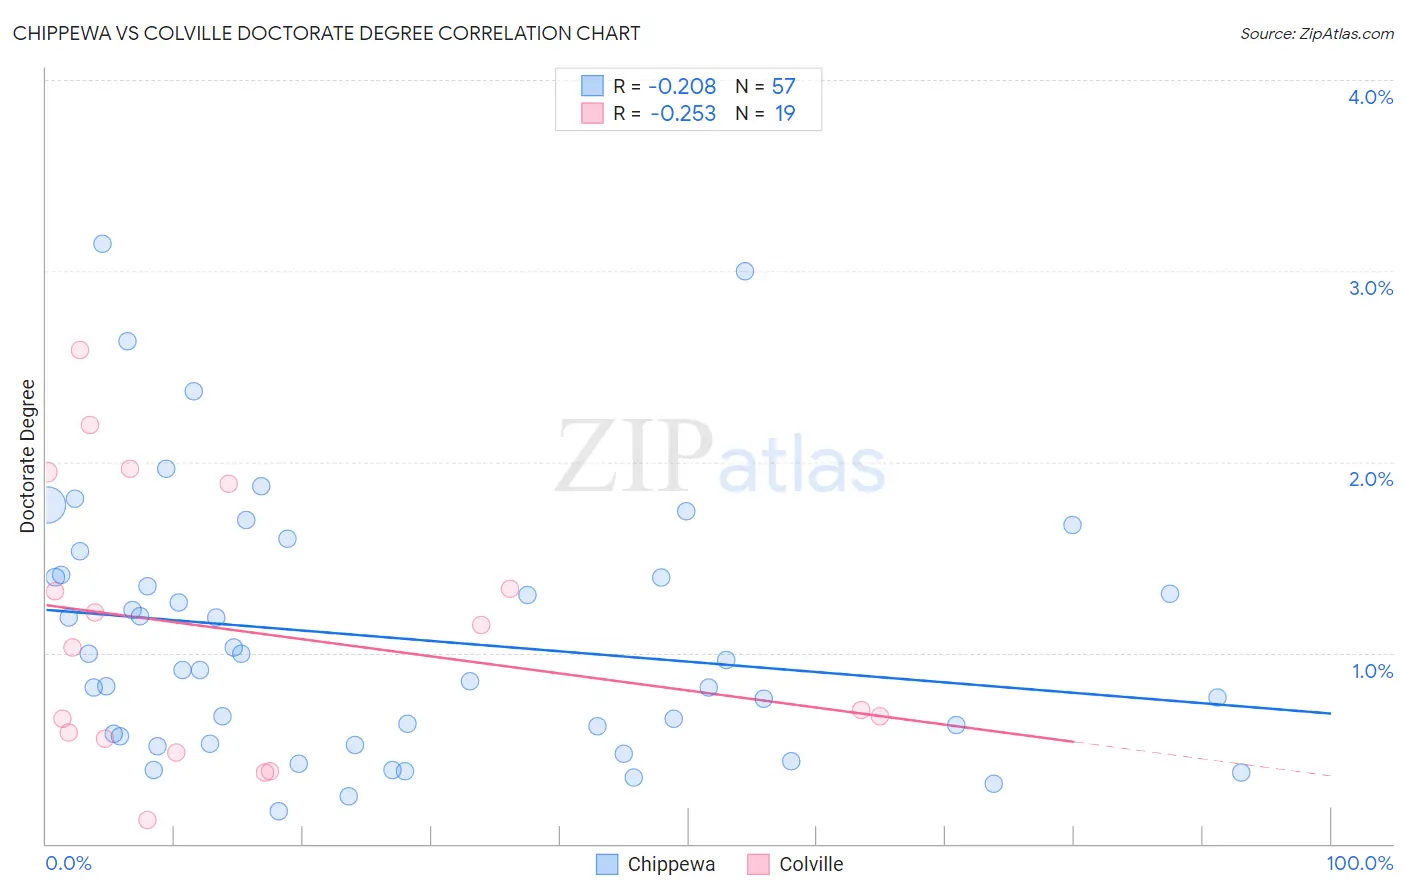
Chippewa vs Colville Doctorate Degree Correlation Chart
The statistical analysis conducted on geographies consisting of 212,158,664 people shows a weak negative correlation between the proportion of Chippewa and percentage of population with at least doctorate degree education in the United States with a correlation coefficient (R) of -0.208 and weighted average of 1.5%. Similarly, the statistical analysis conducted on geographies consisting of 34,569,662 people shows a weak negative correlation between the proportion of Colville and percentage of population with at least doctorate degree education in the United States with a correlation coefficient (R) of -0.253 and weighted average of 1.6%, a difference of 7.3%.
Doctorate Degree Correlation Summary
| Measurement | Chippewa | Colville |
| Minimum | 0.17% | 0.12% |
| Maximum | 3.1% | 2.6% |
| Range | 3.0% | 2.5% |
| Mean | 1.1% | 1.1% |
| Median | 0.91% | 1.0% |
| Interquartile 25% (IQ1) | 0.54% | 0.55% |
| Interquartile 75% (IQ3) | 1.4% | 1.9% |
| Interquartile Range (IQR) | 0.86% | 1.3% |
| Standard Deviation (Sample) | 0.67% | 0.71% |
| Standard Deviation (Population) | 0.67% | 0.69% |
Similar Demographics by Doctorate Degree
Demographics Similar to Chippewa by Doctorate Degree
In terms of doctorate degree, the demographic groups most similar to Chippewa are Central American Indian (1.5%, a difference of 0.22%), Immigrants from West Indies (1.5%, a difference of 0.26%), Immigrants from Cambodia (1.5%, a difference of 0.27%), Trinidadian and Tobagonian (1.5%, a difference of 0.27%), and Liberian (1.5%, a difference of 0.28%).
| Demographics | Rating | Rank | Doctorate Degree |
| Immigrants | Fiji | 1.6 /100 | #250 | Tragic 1.6% |
| Apache | 1.3 /100 | #251 | Tragic 1.5% |
| Yuman | 1.1 /100 | #252 | Tragic 1.5% |
| Americans | 1.0 /100 | #253 | Tragic 1.5% |
| Immigrants | Cambodia | 1.0 /100 | #254 | Tragic 1.5% |
| Trinidadians and Tobagonians | 1.0 /100 | #255 | Tragic 1.5% |
| Central American Indians | 1.0 /100 | #256 | Tragic 1.5% |
| Chippewa | 0.9 /100 | #257 | Tragic 1.5% |
| Immigrants | West Indies | 0.9 /100 | #258 | Tragic 1.5% |
| Liberians | 0.9 /100 | #259 | Tragic 1.5% |
| Japanese | 0.9 /100 | #260 | Tragic 1.5% |
| Immigrants | Portugal | 0.8 /100 | #261 | Tragic 1.5% |
| Chickasaw | 0.7 /100 | #262 | Tragic 1.5% |
| Immigrants | Bahamas | 0.7 /100 | #263 | Tragic 1.5% |
| Blackfeet | 0.7 /100 | #264 | Tragic 1.5% |
Demographics Similar to Colville by Doctorate Degree
In terms of doctorate degree, the demographic groups most similar to Colville are Immigrants from Philippines (1.6%, a difference of 0.31%), Immigrants from North Macedonia (1.6%, a difference of 0.78%), Assyrian/Chaldean/Syriac (1.7%, a difference of 1.0%), Panamanian (1.7%, a difference of 1.3%), and Osage (1.7%, a difference of 1.4%).
| Demographics | Rating | Rank | Doctorate Degree |
| Immigrants | Venezuela | 8.7 /100 | #222 | Tragic 1.7% |
| Immigrants | Bosnia and Herzegovina | 7.8 /100 | #223 | Tragic 1.7% |
| Immigrants | Poland | 7.4 /100 | #224 | Tragic 1.7% |
| Immigrants | Colombia | 6.7 /100 | #225 | Tragic 1.7% |
| Osage | 6.5 /100 | #226 | Tragic 1.7% |
| Panamanians | 6.3 /100 | #227 | Tragic 1.7% |
| Assyrians/Chaldeans/Syriacs | 5.9 /100 | #228 | Tragic 1.7% |
| Colville | 4.7 /100 | #229 | Tragic 1.6% |
| Immigrants | Philippines | 4.3 /100 | #230 | Tragic 1.6% |
| Immigrants | North Macedonia | 3.9 /100 | #231 | Tragic 1.6% |
| Guamanians/Chamorros | 3.3 /100 | #232 | Tragic 1.6% |
| Barbadians | 3.3 /100 | #233 | Tragic 1.6% |
| Hopi | 3.2 /100 | #234 | Tragic 1.6% |
| Cree | 3.0 /100 | #235 | Tragic 1.6% |
| Indonesians | 2.8 /100 | #236 | Tragic 1.6% |