Pueblo vs Finnish No Schooling Completed
COMPARE
Pueblo
Finnish
No Schooling Completed
No Schooling Completed Comparison
Pueblo
Finns
1.9%
NO SCHOOLING COMPLETED
96.4/ 100
METRIC RATING
112th/ 347
METRIC RANK
1.5%
NO SCHOOLING COMPLETED
100.0/ 100
METRIC RATING
16th/ 347
METRIC RANK
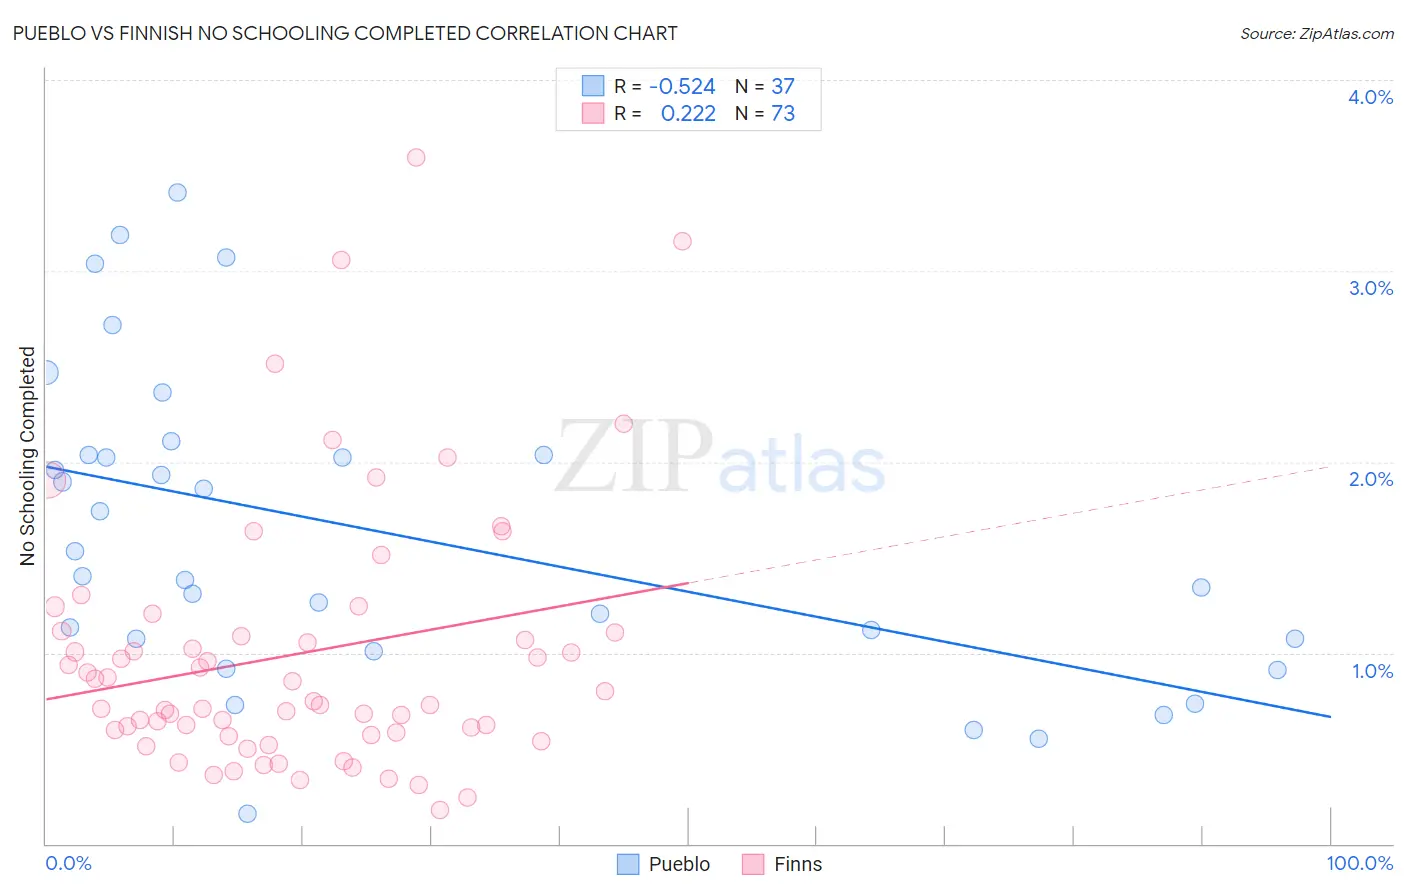
Pueblo vs Finnish No Schooling Completed Correlation Chart
The statistical analysis conducted on geographies consisting of 119,717,699 people shows a substantial negative correlation between the proportion of Pueblo and percentage of population with no schooling in the United States with a correlation coefficient (R) of -0.524 and weighted average of 1.9%. Similarly, the statistical analysis conducted on geographies consisting of 398,073,835 people shows a weak positive correlation between the proportion of Finns and percentage of population with no schooling in the United States with a correlation coefficient (R) of 0.222 and weighted average of 1.5%, a difference of 27.5%.
No Schooling Completed Correlation Summary
| Measurement | Pueblo | Finnish |
| Minimum | 0.16% | 0.18% |
| Maximum | 3.4% | 3.6% |
| Range | 3.2% | 3.4% |
| Mean | 1.6% | 0.99% |
| Median | 1.4% | 0.75% |
| Interquartile 25% (IQ1) | 1.0% | 0.58% |
| Interquartile 75% (IQ3) | 2.0% | 1.1% |
| Interquartile Range (IQR) | 1.00% | 0.53% |
| Standard Deviation (Sample) | 0.81% | 0.68% |
| Standard Deviation (Population) | 0.80% | 0.68% |
Similar Demographics by No Schooling Completed
Demographics Similar to Pueblo by No Schooling Completed
In terms of no schooling completed, the demographic groups most similar to Pueblo are Immigrants from Japan (1.9%, a difference of 0.19%), Immigrants from Zimbabwe (1.9%, a difference of 0.25%), Immigrants from Norway (1.9%, a difference of 0.25%), Immigrants from Latvia (1.9%, a difference of 0.33%), and Syrian (1.9%, a difference of 0.38%).
| Demographics | Rating | Rank | No Schooling Completed |
| German Russians | 97.5 /100 | #105 | Exceptional 1.8% |
| Immigrants | France | 97.3 /100 | #106 | Exceptional 1.8% |
| Yugoslavians | 97.2 /100 | #107 | Exceptional 1.8% |
| Okinawans | 97.1 /100 | #108 | Exceptional 1.8% |
| Immigrants | Saudi Arabia | 96.8 /100 | #109 | Exceptional 1.9% |
| Immigrants | Latvia | 96.7 /100 | #110 | Exceptional 1.9% |
| Immigrants | Japan | 96.6 /100 | #111 | Exceptional 1.9% |
| Pueblo | 96.4 /100 | #112 | Exceptional 1.9% |
| Immigrants | Zimbabwe | 96.2 /100 | #113 | Exceptional 1.9% |
| Immigrants | Norway | 96.1 /100 | #114 | Exceptional 1.9% |
| Syrians | 96.0 /100 | #115 | Exceptional 1.9% |
| Lebanese | 96.0 /100 | #116 | Exceptional 1.9% |
| Immigrants | Serbia | 95.8 /100 | #117 | Exceptional 1.9% |
| Spanish | 95.5 /100 | #118 | Exceptional 1.9% |
| Iroquois | 95.1 /100 | #119 | Exceptional 1.9% |
Demographics Similar to Finns by No Schooling Completed
In terms of no schooling completed, the demographic groups most similar to Finns are Croatian (1.5%, a difference of 0.010%), Danish (1.5%, a difference of 0.31%), Alaskan Athabascan (1.5%, a difference of 0.42%), Tlingit-Haida (1.5%, a difference of 0.52%), and Welsh (1.5%, a difference of 0.54%).
| Demographics | Rating | Rank | No Schooling Completed |
| Scottish | 100.0 /100 | #9 | Exceptional 1.4% |
| Dutch | 100.0 /100 | #10 | Exceptional 1.4% |
| Lithuanians | 100.0 /100 | #11 | Exceptional 1.4% |
| Irish | 100.0 /100 | #12 | Exceptional 1.4% |
| Poles | 100.0 /100 | #13 | Exceptional 1.4% |
| Scotch-Irish | 100.0 /100 | #14 | Exceptional 1.5% |
| Tlingit-Haida | 100.0 /100 | #15 | Exceptional 1.5% |
| Finns | 100.0 /100 | #16 | Exceptional 1.5% |
| Croatians | 100.0 /100 | #17 | Exceptional 1.5% |
| Danes | 100.0 /100 | #18 | Exceptional 1.5% |
| Alaskan Athabascans | 100.0 /100 | #19 | Exceptional 1.5% |
| Welsh | 100.0 /100 | #20 | Exceptional 1.5% |
| Chinese | 100.0 /100 | #21 | Exceptional 1.5% |
| Alaska Natives | 100.0 /100 | #22 | Exceptional 1.5% |
| Europeans | 100.0 /100 | #23 | Exceptional 1.5% |