Chippewa vs Alsatian Professional Degree
COMPARE
Chippewa
Alsatian
Professional Degree
Professional Degree Comparison
Chippewa
Alsatians
3.5%
PROFESSIONAL DEGREE
0.3/ 100
METRIC RATING
290th/ 347
METRIC RANK
5.2%
PROFESSIONAL DEGREE
99.3/ 100
METRIC RATING
94th/ 347
METRIC RANK
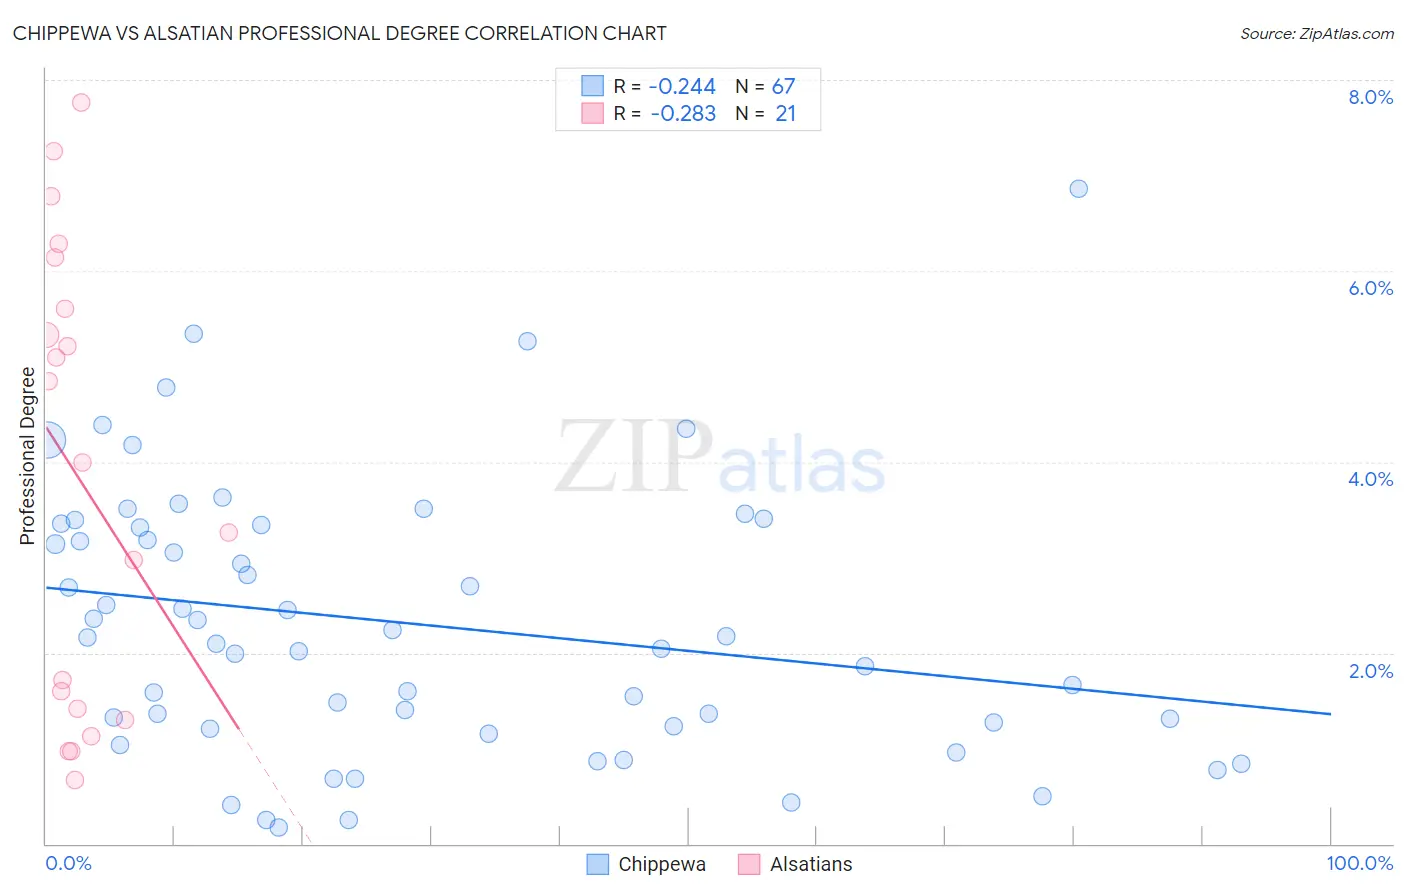
Chippewa vs Alsatian Professional Degree Correlation Chart
The statistical analysis conducted on geographies consisting of 214,425,130 people shows a weak negative correlation between the proportion of Chippewa and percentage of population with at least professional degree education in the United States with a correlation coefficient (R) of -0.244 and weighted average of 3.5%. Similarly, the statistical analysis conducted on geographies consisting of 82,635,637 people shows a weak negative correlation between the proportion of Alsatians and percentage of population with at least professional degree education in the United States with a correlation coefficient (R) of -0.283 and weighted average of 5.2%, a difference of 50.1%.
Professional Degree Correlation Summary
| Measurement | Chippewa | Alsatian |
| Minimum | 0.17% | 0.66% |
| Maximum | 6.9% | 7.8% |
| Range | 6.7% | 7.1% |
| Mean | 2.3% | 3.8% |
| Median | 2.2% | 4.0% |
| Interquartile 25% (IQ1) | 1.2% | 1.4% |
| Interquartile 75% (IQ3) | 3.3% | 5.9% |
| Interquartile Range (IQR) | 2.1% | 4.5% |
| Standard Deviation (Sample) | 1.4% | 2.4% |
| Standard Deviation (Population) | 1.4% | 2.3% |
Similar Demographics by Professional Degree
Demographics Similar to Chippewa by Professional Degree
In terms of professional degree, the demographic groups most similar to Chippewa are Guatemalan (3.5%, a difference of 0.010%), Alaska Native (3.5%, a difference of 0.17%), Blackfeet (3.5%, a difference of 0.19%), Immigrants from El Salvador (3.5%, a difference of 0.23%), and Immigrants from Belize (3.5%, a difference of 0.24%).
| Demographics | Rating | Rank | Professional Degree |
| Comanche | 0.4 /100 | #283 | Tragic 3.5% |
| Salvadorans | 0.4 /100 | #284 | Tragic 3.5% |
| Hondurans | 0.3 /100 | #285 | Tragic 3.5% |
| Haitians | 0.3 /100 | #286 | Tragic 3.5% |
| Immigrants | El Salvador | 0.3 /100 | #287 | Tragic 3.5% |
| Blackfeet | 0.3 /100 | #288 | Tragic 3.5% |
| Guatemalans | 0.3 /100 | #289 | Tragic 3.5% |
| Chippewa | 0.3 /100 | #290 | Tragic 3.5% |
| Alaska Natives | 0.3 /100 | #291 | Tragic 3.5% |
| Immigrants | Belize | 0.3 /100 | #292 | Tragic 3.5% |
| Immigrants | Honduras | 0.3 /100 | #293 | Tragic 3.5% |
| Paiute | 0.3 /100 | #294 | Tragic 3.4% |
| Immigrants | Guatemala | 0.2 /100 | #295 | Tragic 3.4% |
| Hawaiians | 0.2 /100 | #296 | Tragic 3.4% |
| Immigrants | Liberia | 0.2 /100 | #297 | Tragic 3.4% |
Demographics Similar to Alsatians by Professional Degree
In terms of professional degree, the demographic groups most similar to Alsatians are Northern European (5.2%, a difference of 0.020%), Zimbabwean (5.2%, a difference of 0.18%), Immigrants from Uzbekistan (5.2%, a difference of 0.59%), Immigrants from Eastern Europe (5.2%, a difference of 0.66%), and Laotian (5.2%, a difference of 0.70%).
| Demographics | Rating | Rank | Professional Degree |
| Immigrants | Chile | 99.5 /100 | #87 | Exceptional 5.3% |
| Egyptians | 99.5 /100 | #88 | Exceptional 5.3% |
| Chileans | 99.5 /100 | #89 | Exceptional 5.3% |
| Immigrants | Scotland | 99.5 /100 | #90 | Exceptional 5.3% |
| Laotians | 99.5 /100 | #91 | Exceptional 5.2% |
| Immigrants | Eastern Europe | 99.5 /100 | #92 | Exceptional 5.2% |
| Northern Europeans | 99.3 /100 | #93 | Exceptional 5.2% |
| Alsatians | 99.3 /100 | #94 | Exceptional 5.2% |
| Zimbabweans | 99.3 /100 | #95 | Exceptional 5.2% |
| Immigrants | Uzbekistan | 99.2 /100 | #96 | Exceptional 5.2% |
| Syrians | 99.1 /100 | #97 | Exceptional 5.2% |
| Austrians | 99.1 /100 | #98 | Exceptional 5.2% |
| Immigrants | Italy | 99.1 /100 | #99 | Exceptional 5.2% |
| Ugandans | 98.8 /100 | #100 | Exceptional 5.1% |
| Immigrants | Egypt | 98.5 /100 | #101 | Exceptional 5.1% |