Chinese vs Immigrants from Micronesia 6th Grade
COMPARE
Chinese
Immigrants from Micronesia
6th Grade
6th Grade Comparison
Chinese
Immigrants from Micronesia
97.9%
6TH GRADE
100.0/ 100
METRIC RATING
35th/ 347
METRIC RANK
97.0%
6TH GRADE
47.1/ 100
METRIC RATING
176th/ 347
METRIC RANK
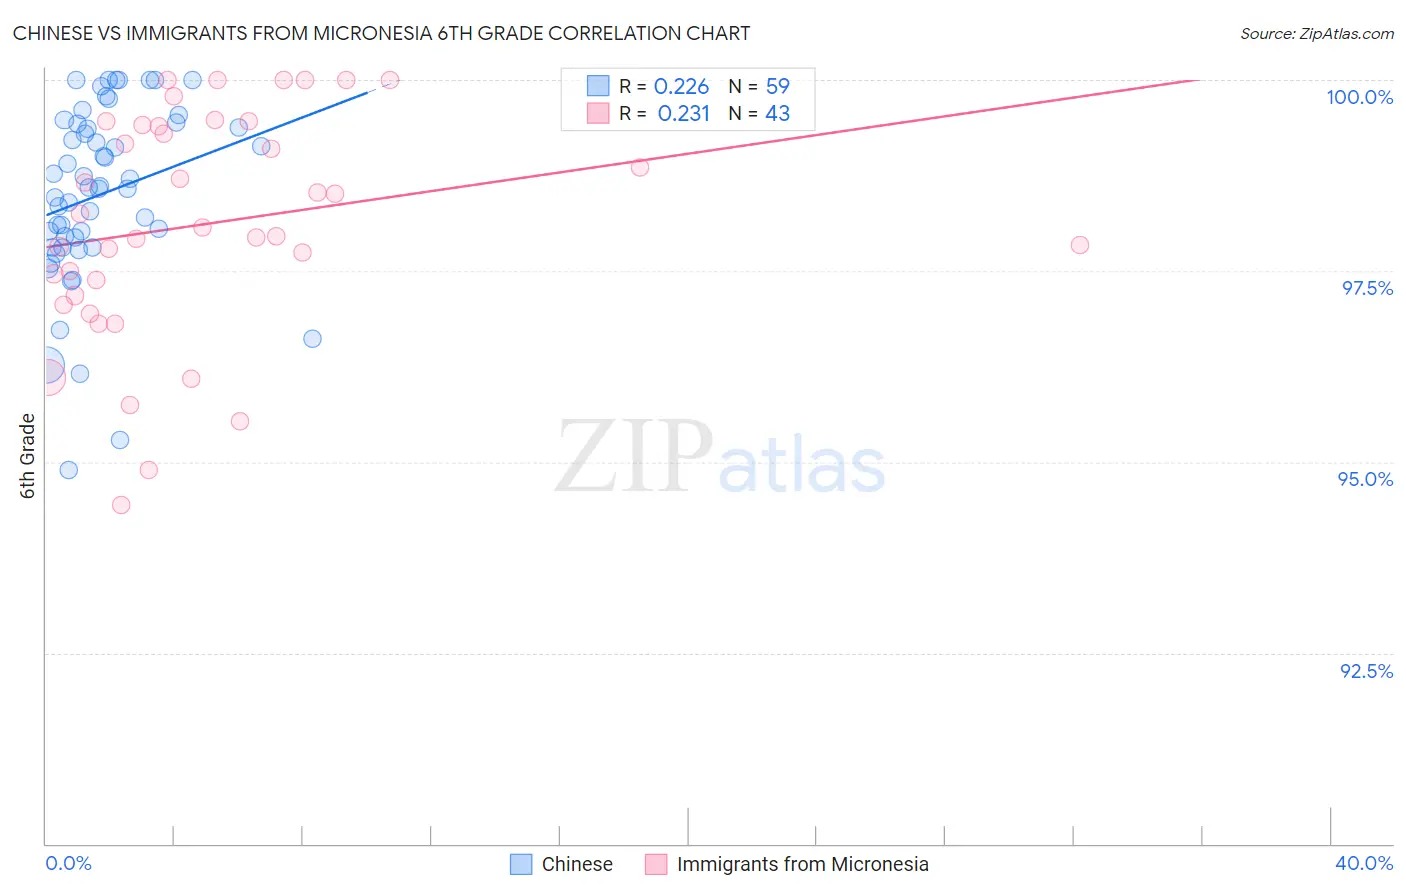
Chinese vs Immigrants from Micronesia 6th Grade Correlation Chart
The statistical analysis conducted on geographies consisting of 64,809,883 people shows a weak positive correlation between the proportion of Chinese and percentage of population with at least 6th grade education in the United States with a correlation coefficient (R) of 0.226 and weighted average of 97.9%. Similarly, the statistical analysis conducted on geographies consisting of 61,604,657 people shows a weak positive correlation between the proportion of Immigrants from Micronesia and percentage of population with at least 6th grade education in the United States with a correlation coefficient (R) of 0.231 and weighted average of 97.0%, a difference of 0.91%.
6th Grade Correlation Summary
| Measurement | Chinese | Immigrants from Micronesia |
| Minimum | 94.9% | 94.4% |
| Maximum | 100.0% | 100.0% |
| Range | 5.1% | 5.6% |
| Mean | 98.5% | 98.1% |
| Median | 98.6% | 98.1% |
| Interquartile 25% (IQ1) | 97.8% | 97.2% |
| Interquartile 75% (IQ3) | 99.4% | 99.4% |
| Interquartile Range (IQR) | 1.6% | 2.2% |
| Standard Deviation (Sample) | 1.2% | 1.5% |
| Standard Deviation (Population) | 1.2% | 1.5% |
Similar Demographics by 6th Grade
Demographics Similar to Chinese by 6th Grade
In terms of 6th grade, the demographic groups most similar to Chinese are Italian (97.9%, a difference of 0.0%), British (97.9%, a difference of 0.010%), Swiss (97.9%, a difference of 0.020%), Chippewa (97.9%, a difference of 0.030%), and Belgian (97.9%, a difference of 0.030%).
| Demographics | Rating | Rank | 6th Grade |
| Scandinavians | 100.0 /100 | #28 | Exceptional 98.0% |
| French | 100.0 /100 | #29 | Exceptional 98.0% |
| French Canadians | 100.0 /100 | #30 | Exceptional 98.0% |
| Europeans | 100.0 /100 | #31 | Exceptional 98.0% |
| Alaska Natives | 100.0 /100 | #32 | Exceptional 98.0% |
| Chippewa | 100.0 /100 | #33 | Exceptional 97.9% |
| Swiss | 100.0 /100 | #34 | Exceptional 97.9% |
| Chinese | 100.0 /100 | #35 | Exceptional 97.9% |
| Italians | 100.0 /100 | #36 | Exceptional 97.9% |
| British | 100.0 /100 | #37 | Exceptional 97.9% |
| Belgians | 100.0 /100 | #38 | Exceptional 97.9% |
| Luxembourgers | 99.9 /100 | #39 | Exceptional 97.9% |
| Latvians | 99.9 /100 | #40 | Exceptional 97.9% |
| Eastern Europeans | 99.9 /100 | #41 | Exceptional 97.9% |
| Hungarians | 99.9 /100 | #42 | Exceptional 97.8% |
Demographics Similar to Immigrants from Micronesia by 6th Grade
In terms of 6th grade, the demographic groups most similar to Immigrants from Micronesia are Immigrants from Kazakhstan (97.0%, a difference of 0.0%), Mongolian (97.0%, a difference of 0.0%), Arab (97.0%, a difference of 0.010%), Venezuelan (97.0%, a difference of 0.010%), and Pakistani (97.0%, a difference of 0.010%).
| Demographics | Rating | Rank | 6th Grade |
| Bermudans | 52.6 /100 | #169 | Average 97.1% |
| Chileans | 52.1 /100 | #170 | Average 97.1% |
| Immigrants | Sri Lanka | 51.7 /100 | #171 | Average 97.1% |
| Egyptians | 50.9 /100 | #172 | Average 97.1% |
| Arabs | 50.1 /100 | #173 | Average 97.0% |
| Venezuelans | 50.0 /100 | #174 | Average 97.0% |
| Immigrants | Kazakhstan | 47.3 /100 | #175 | Average 97.0% |
| Immigrants | Micronesia | 47.1 /100 | #176 | Average 97.0% |
| Mongolians | 46.7 /100 | #177 | Average 97.0% |
| Pakistanis | 46.0 /100 | #178 | Average 97.0% |
| Immigrants | Kenya | 45.3 /100 | #179 | Average 97.0% |
| Immigrants | Spain | 39.9 /100 | #180 | Fair 97.0% |
| Comanche | 37.9 /100 | #181 | Fair 97.0% |
| Immigrants | Ukraine | 35.6 /100 | #182 | Fair 97.0% |
| Immigrants | Venezuela | 34.5 /100 | #183 | Fair 97.0% |