Chinese vs Australian Bachelor's Degree
COMPARE
Chinese
Australian
Bachelor's Degree
Bachelor's Degree Comparison
Chinese
Australians
38.5%
BACHELOR'S DEGREE
66.6/ 100
METRIC RATING
159th/ 347
METRIC RANK
44.0%
BACHELOR'S DEGREE
99.9/ 100
METRIC RATING
59th/ 347
METRIC RANK
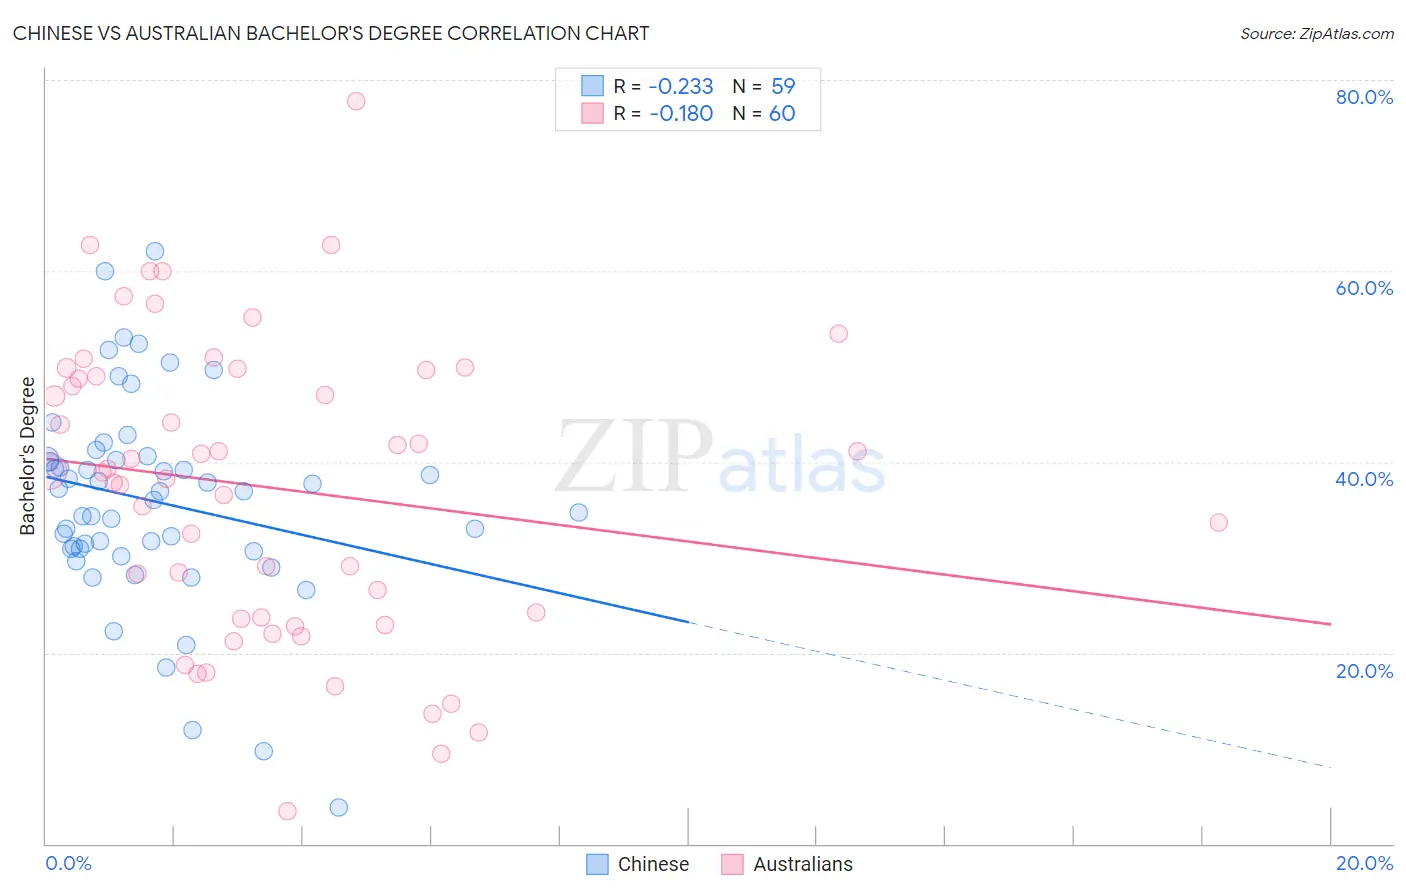
Chinese vs Australian Bachelor's Degree Correlation Chart
The statistical analysis conducted on geographies consisting of 64,809,883 people shows a weak negative correlation between the proportion of Chinese and percentage of population with at least bachelor's degree education in the United States with a correlation coefficient (R) of -0.233 and weighted average of 38.5%. Similarly, the statistical analysis conducted on geographies consisting of 224,140,970 people shows a poor negative correlation between the proportion of Australians and percentage of population with at least bachelor's degree education in the United States with a correlation coefficient (R) of -0.180 and weighted average of 44.0%, a difference of 14.3%.
Bachelor's Degree Correlation Summary
| Measurement | Chinese | Australian |
| Minimum | 3.8% | 3.4% |
| Maximum | 62.0% | 77.7% |
| Range | 58.3% | 74.3% |
| Mean | 35.8% | 37.3% |
| Median | 36.9% | 38.9% |
| Interquartile 25% (IQ1) | 30.9% | 23.7% |
| Interquartile 75% (IQ3) | 40.3% | 49.3% |
| Interquartile Range (IQR) | 9.4% | 25.7% |
| Standard Deviation (Sample) | 10.8% | 15.6% |
| Standard Deviation (Population) | 10.7% | 15.5% |
Similar Demographics by Bachelor's Degree
Demographics Similar to Chinese by Bachelor's Degree
In terms of bachelor's degree, the demographic groups most similar to Chinese are Vietnamese (38.5%, a difference of 0.0%), Uruguayan (38.4%, a difference of 0.090%), Colombian (38.4%, a difference of 0.17%), Immigrants from Germany (38.6%, a difference of 0.33%), and Peruvian (38.3%, a difference of 0.34%).
| Demographics | Rating | Rank | Bachelor's Degree |
| Sudanese | 76.4 /100 | #152 | Good 38.9% |
| Slavs | 75.9 /100 | #153 | Good 38.9% |
| Canadians | 75.0 /100 | #154 | Good 38.8% |
| Immigrants | Kenya | 73.8 /100 | #155 | Good 38.8% |
| Kenyans | 72.5 /100 | #156 | Good 38.7% |
| Immigrants | South America | 70.1 /100 | #157 | Good 38.6% |
| Immigrants | Germany | 69.6 /100 | #158 | Good 38.6% |
| Chinese | 66.6 /100 | #159 | Good 38.5% |
| Vietnamese | 66.6 /100 | #160 | Good 38.5% |
| Uruguayans | 65.8 /100 | #161 | Good 38.4% |
| Colombians | 65.0 /100 | #162 | Good 38.4% |
| Peruvians | 63.4 /100 | #163 | Good 38.3% |
| Hungarians | 62.1 /100 | #164 | Good 38.3% |
| Sri Lankans | 59.1 /100 | #165 | Average 38.2% |
| Somalis | 58.6 /100 | #166 | Average 38.1% |
Demographics Similar to Australians by Bachelor's Degree
In terms of bachelor's degree, the demographic groups most similar to Australians are New Zealander (44.0%, a difference of 0.010%), Immigrants from Czechoslovakia (44.0%, a difference of 0.10%), Paraguayan (44.0%, a difference of 0.16%), Immigrants from Serbia (44.1%, a difference of 0.34%), and Immigrants from Austria (44.2%, a difference of 0.53%).
| Demographics | Rating | Rank | Bachelor's Degree |
| Immigrants | Spain | 99.9 /100 | #52 | Exceptional 44.3% |
| Immigrants | Asia | 99.9 /100 | #53 | Exceptional 44.3% |
| Immigrants | Austria | 99.9 /100 | #54 | Exceptional 44.2% |
| Immigrants | Bolivia | 99.9 /100 | #55 | Exceptional 44.2% |
| Immigrants | Serbia | 99.9 /100 | #56 | Exceptional 44.1% |
| Paraguayans | 99.9 /100 | #57 | Exceptional 44.0% |
| Immigrants | Czechoslovakia | 99.9 /100 | #58 | Exceptional 44.0% |
| Australians | 99.9 /100 | #59 | Exceptional 44.0% |
| New Zealanders | 99.9 /100 | #60 | Exceptional 44.0% |
| South Africans | 99.8 /100 | #61 | Exceptional 43.6% |
| Immigrants | Kazakhstan | 99.8 /100 | #62 | Exceptional 43.4% |
| Immigrants | Europe | 99.8 /100 | #63 | Exceptional 43.4% |
| Argentineans | 99.7 /100 | #64 | Exceptional 43.3% |
| Zimbabweans | 99.7 /100 | #65 | Exceptional 43.3% |
| Immigrants | Netherlands | 99.7 /100 | #66 | Exceptional 43.3% |