Swiss vs Alaska Native Professional Degree
COMPARE
Swiss
Alaska Native
Professional Degree
Professional Degree Comparison
Swiss
Alaska Natives
4.5%
PROFESSIONAL DEGREE
61.0/ 100
METRIC RATING
164th/ 347
METRIC RANK
3.5%
PROFESSIONAL DEGREE
0.3/ 100
METRIC RATING
291st/ 347
METRIC RANK
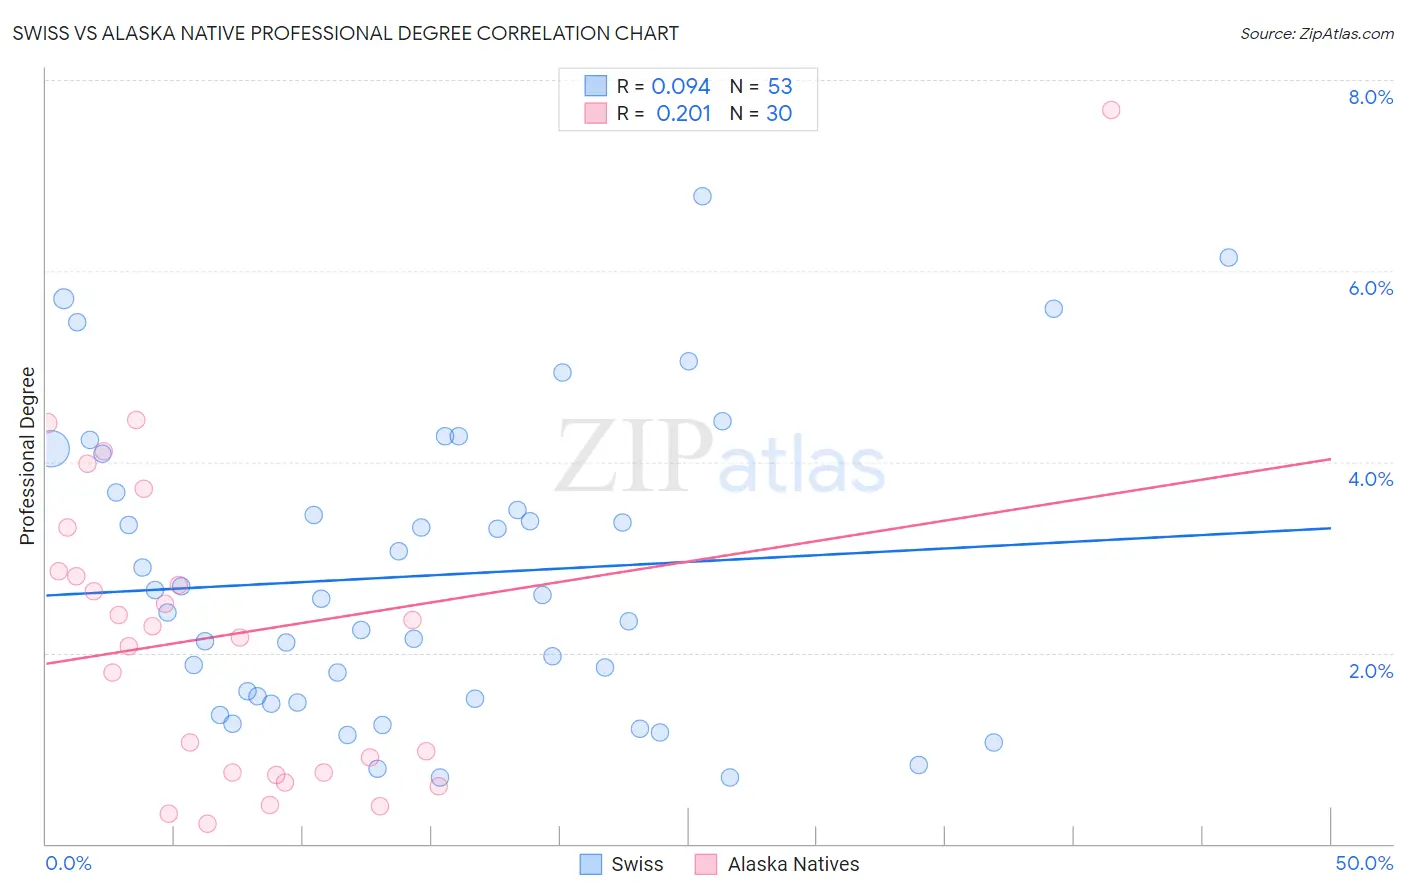
Swiss vs Alaska Native Professional Degree Correlation Chart
The statistical analysis conducted on geographies consisting of 462,554,590 people shows a slight positive correlation between the proportion of Swiss and percentage of population with at least professional degree education in the United States with a correlation coefficient (R) of 0.094 and weighted average of 4.5%. Similarly, the statistical analysis conducted on geographies consisting of 76,648,508 people shows a weak positive correlation between the proportion of Alaska Natives and percentage of population with at least professional degree education in the United States with a correlation coefficient (R) of 0.201 and weighted average of 3.5%, a difference of 29.3%.
Professional Degree Correlation Summary
| Measurement | Swiss | Alaska Native |
| Minimum | 0.69% | 0.21% |
| Maximum | 6.8% | 7.7% |
| Range | 6.1% | 7.5% |
| Mean | 2.8% | 2.2% |
| Median | 2.6% | 2.2% |
| Interquartile 25% (IQ1) | 1.5% | 0.74% |
| Interquartile 75% (IQ3) | 3.9% | 2.9% |
| Interquartile Range (IQR) | 2.4% | 2.1% |
| Standard Deviation (Sample) | 1.5% | 1.7% |
| Standard Deviation (Population) | 1.5% | 1.7% |
Similar Demographics by Professional Degree
Demographics Similar to Swiss by Professional Degree
In terms of professional degree, the demographic groups most similar to Swiss are Costa Rican (4.5%, a difference of 0.17%), Immigrants from Colombia (4.5%, a difference of 0.24%), Immigrants from Afghanistan (4.5%, a difference of 0.27%), Immigrants from Sierra Leone (4.5%, a difference of 0.34%), and Chinese (4.5%, a difference of 0.36%).
| Demographics | Rating | Rank | Professional Degree |
| Iraqis | 69.8 /100 | #157 | Good 4.5% |
| Immigrants | Armenia | 68.8 /100 | #158 | Good 4.5% |
| Vietnamese | 68.4 /100 | #159 | Good 4.5% |
| Immigrants | Senegal | 68.0 /100 | #160 | Good 4.5% |
| Assyrians/Chaldeans/Syriacs | 67.4 /100 | #161 | Good 4.5% |
| Peruvians | 65.2 /100 | #162 | Good 4.5% |
| Sierra Leoneans | 64.3 /100 | #163 | Good 4.5% |
| Swiss | 61.0 /100 | #164 | Good 4.5% |
| Costa Ricans | 59.9 /100 | #165 | Average 4.5% |
| Immigrants | Colombia | 59.4 /100 | #166 | Average 4.5% |
| Immigrants | Afghanistan | 59.2 /100 | #167 | Average 4.5% |
| Immigrants | Sierra Leone | 58.7 /100 | #168 | Average 4.5% |
| Chinese | 58.6 /100 | #169 | Average 4.5% |
| Immigrants | Zaire | 57.4 /100 | #170 | Average 4.5% |
| Immigrants | Bangladesh | 56.0 /100 | #171 | Average 4.4% |
Demographics Similar to Alaska Natives by Professional Degree
In terms of professional degree, the demographic groups most similar to Alaska Natives are Immigrants from Belize (3.5%, a difference of 0.070%), Chippewa (3.5%, a difference of 0.17%), Guatemalan (3.5%, a difference of 0.18%), Immigrants from Honduras (3.5%, a difference of 0.30%), and Blackfeet (3.5%, a difference of 0.36%).
| Demographics | Rating | Rank | Professional Degree |
| Salvadorans | 0.4 /100 | #284 | Tragic 3.5% |
| Hondurans | 0.3 /100 | #285 | Tragic 3.5% |
| Haitians | 0.3 /100 | #286 | Tragic 3.5% |
| Immigrants | El Salvador | 0.3 /100 | #287 | Tragic 3.5% |
| Blackfeet | 0.3 /100 | #288 | Tragic 3.5% |
| Guatemalans | 0.3 /100 | #289 | Tragic 3.5% |
| Chippewa | 0.3 /100 | #290 | Tragic 3.5% |
| Alaska Natives | 0.3 /100 | #291 | Tragic 3.5% |
| Immigrants | Belize | 0.3 /100 | #292 | Tragic 3.5% |
| Immigrants | Honduras | 0.3 /100 | #293 | Tragic 3.5% |
| Paiute | 0.3 /100 | #294 | Tragic 3.4% |
| Immigrants | Guatemala | 0.2 /100 | #295 | Tragic 3.4% |
| Hawaiians | 0.2 /100 | #296 | Tragic 3.4% |
| Immigrants | Liberia | 0.2 /100 | #297 | Tragic 3.4% |
| Ottawa | 0.2 /100 | #298 | Tragic 3.4% |