Chickasaw vs Colombian Professional Degree
COMPARE
Chickasaw
Colombian
Professional Degree
Professional Degree Comparison
Chickasaw
Colombians
3.4%
PROFESSIONAL DEGREE
0.1/ 100
METRIC RATING
305th/ 347
METRIC RANK
4.6%
PROFESSIONAL DEGREE
77.7/ 100
METRIC RATING
147th/ 347
METRIC RANK
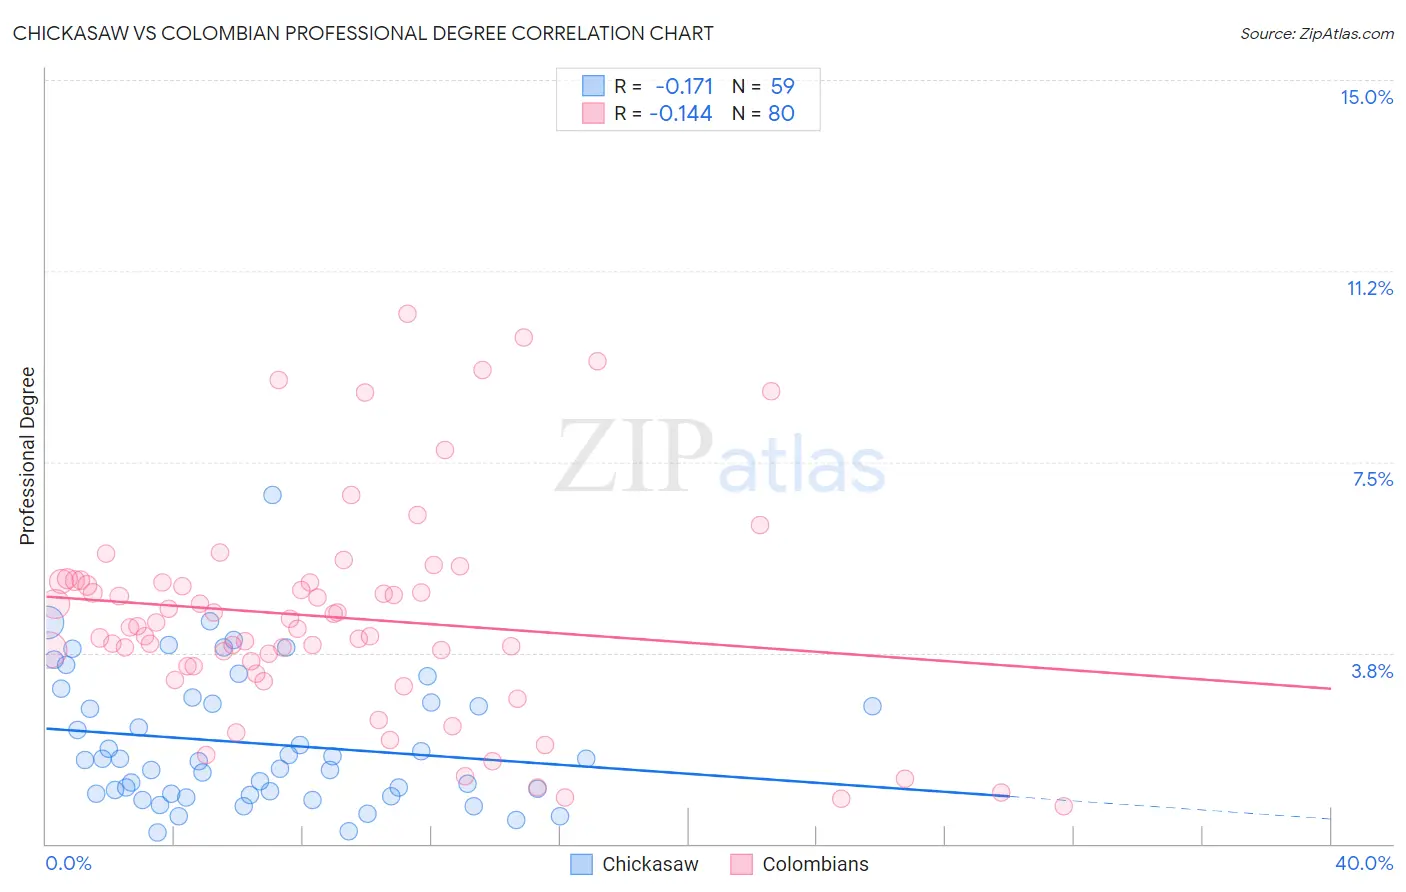
Chickasaw vs Colombian Professional Degree Correlation Chart
The statistical analysis conducted on geographies consisting of 147,338,770 people shows a poor negative correlation between the proportion of Chickasaw and percentage of population with at least professional degree education in the United States with a correlation coefficient (R) of -0.171 and weighted average of 3.4%. Similarly, the statistical analysis conducted on geographies consisting of 418,695,587 people shows a poor negative correlation between the proportion of Colombians and percentage of population with at least professional degree education in the United States with a correlation coefficient (R) of -0.144 and weighted average of 4.6%, a difference of 37.0%.
Professional Degree Correlation Summary
| Measurement | Chickasaw | Colombian |
| Minimum | 0.21% | 0.74% |
| Maximum | 6.9% | 10.4% |
| Range | 6.6% | 9.7% |
| Mean | 2.0% | 4.5% |
| Median | 1.6% | 4.3% |
| Interquartile 25% (IQ1) | 0.98% | 3.5% |
| Interquartile 75% (IQ3) | 2.8% | 5.1% |
| Interquartile Range (IQR) | 1.8% | 1.7% |
| Standard Deviation (Sample) | 1.3% | 2.1% |
| Standard Deviation (Population) | 1.3% | 2.1% |
Similar Demographics by Professional Degree
Demographics Similar to Chickasaw by Professional Degree
In terms of professional degree, the demographic groups most similar to Chickasaw are Cape Verdean (3.4%, a difference of 0.010%), Cajun (3.4%, a difference of 0.30%), Immigrants from Haiti (3.4%, a difference of 0.31%), Malaysian (3.4%, a difference of 0.97%), and Samoan (3.3%, a difference of 1.1%).
| Demographics | Rating | Rank | Professional Degree |
| Ottawa | 0.2 /100 | #298 | Tragic 3.4% |
| Immigrants | Yemen | 0.2 /100 | #299 | Tragic 3.4% |
| Blacks/African Americans | 0.2 /100 | #300 | Tragic 3.4% |
| Immigrants | Dominican Republic | 0.2 /100 | #301 | Tragic 3.4% |
| Malaysians | 0.2 /100 | #302 | Tragic 3.4% |
| Immigrants | Haiti | 0.2 /100 | #303 | Tragic 3.4% |
| Cajuns | 0.2 /100 | #304 | Tragic 3.4% |
| Chickasaw | 0.1 /100 | #305 | Tragic 3.4% |
| Cape Verdeans | 0.1 /100 | #306 | Tragic 3.4% |
| Samoans | 0.1 /100 | #307 | Tragic 3.3% |
| Shoshone | 0.1 /100 | #308 | Tragic 3.3% |
| Pima | 0.1 /100 | #309 | Tragic 3.3% |
| Immigrants | Latin America | 0.1 /100 | #310 | Tragic 3.3% |
| Cherokee | 0.1 /100 | #311 | Tragic 3.3% |
| Sioux | 0.1 /100 | #312 | Tragic 3.3% |
Demographics Similar to Colombians by Professional Degree
In terms of professional degree, the demographic groups most similar to Colombians are Luxembourger (4.6%, a difference of 0.21%), Slovene (4.6%, a difference of 0.32%), Senegalese (4.6%, a difference of 0.46%), Uruguayan (4.6%, a difference of 0.53%), and Immigrants from South America (4.6%, a difference of 0.58%).
| Demographics | Rating | Rank | Professional Degree |
| Canadians | 84.4 /100 | #140 | Excellent 4.7% |
| Basques | 81.8 /100 | #141 | Excellent 4.6% |
| Sudanese | 81.3 /100 | #142 | Excellent 4.6% |
| Hungarians | 80.8 /100 | #143 | Excellent 4.6% |
| Immigrants | South America | 80.5 /100 | #144 | Excellent 4.6% |
| Uruguayans | 80.2 /100 | #145 | Excellent 4.6% |
| Luxembourgers | 78.7 /100 | #146 | Good 4.6% |
| Colombians | 77.7 /100 | #147 | Good 4.6% |
| Slovenes | 76.1 /100 | #148 | Good 4.6% |
| Senegalese | 75.3 /100 | #149 | Good 4.6% |
| Immigrants | Oceania | 73.4 /100 | #150 | Good 4.6% |
| Poles | 72.6 /100 | #151 | Good 4.6% |
| Immigrants | Africa | 72.5 /100 | #152 | Good 4.6% |
| Immigrants | Uruguay | 72.5 /100 | #153 | Good 4.6% |
| Scottish | 71.8 /100 | #154 | Good 4.6% |