Chickasaw vs Belgian Professional Degree
COMPARE
Chickasaw
Belgian
Professional Degree
Professional Degree Comparison
Chickasaw
Belgians
3.4%
PROFESSIONAL DEGREE
0.1/ 100
METRIC RATING
305th/ 347
METRIC RANK
4.3%
PROFESSIONAL DEGREE
36.2/ 100
METRIC RATING
184th/ 347
METRIC RANK
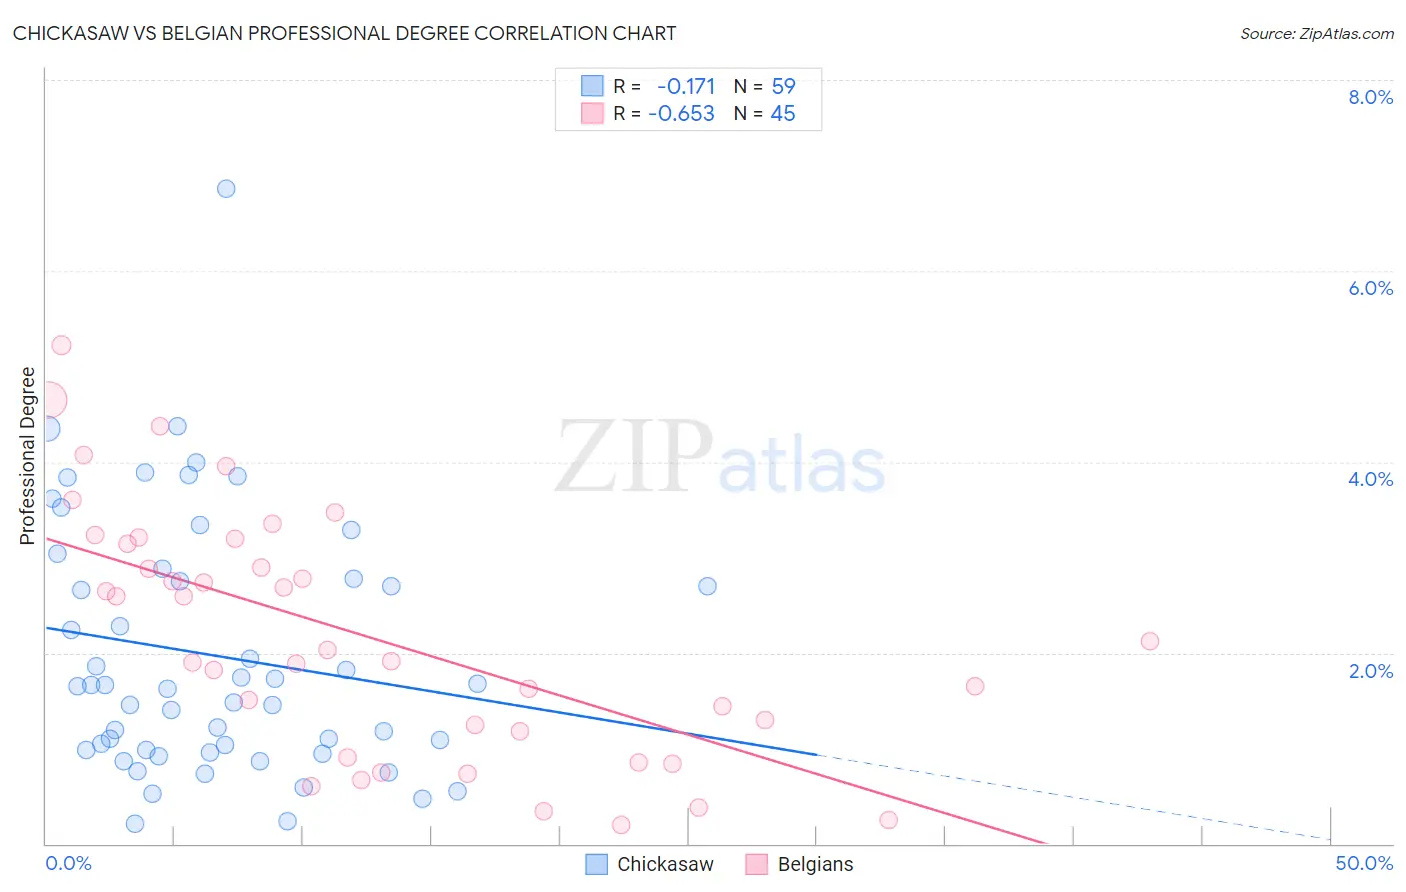
Chickasaw vs Belgian Professional Degree Correlation Chart
The statistical analysis conducted on geographies consisting of 147,338,770 people shows a poor negative correlation between the proportion of Chickasaw and percentage of population with at least professional degree education in the United States with a correlation coefficient (R) of -0.171 and weighted average of 3.4%. Similarly, the statistical analysis conducted on geographies consisting of 355,034,789 people shows a significant negative correlation between the proportion of Belgians and percentage of population with at least professional degree education in the United States with a correlation coefficient (R) of -0.653 and weighted average of 4.3%, a difference of 28.4%.
Professional Degree Correlation Summary
| Measurement | Chickasaw | Belgian |
| Minimum | 0.21% | 0.19% |
| Maximum | 6.9% | 5.2% |
| Range | 6.6% | 5.0% |
| Mean | 2.0% | 2.2% |
| Median | 1.6% | 2.0% |
| Interquartile 25% (IQ1) | 0.98% | 1.0% |
| Interquartile 75% (IQ3) | 2.8% | 3.2% |
| Interquartile Range (IQR) | 1.8% | 2.1% |
| Standard Deviation (Sample) | 1.3% | 1.3% |
| Standard Deviation (Population) | 1.3% | 1.3% |
Similar Demographics by Professional Degree
Demographics Similar to Chickasaw by Professional Degree
In terms of professional degree, the demographic groups most similar to Chickasaw are Cape Verdean (3.4%, a difference of 0.010%), Cajun (3.4%, a difference of 0.30%), Immigrants from Haiti (3.4%, a difference of 0.31%), Malaysian (3.4%, a difference of 0.97%), and Samoan (3.3%, a difference of 1.1%).
| Demographics | Rating | Rank | Professional Degree |
| Ottawa | 0.2 /100 | #298 | Tragic 3.4% |
| Immigrants | Yemen | 0.2 /100 | #299 | Tragic 3.4% |
| Blacks/African Americans | 0.2 /100 | #300 | Tragic 3.4% |
| Immigrants | Dominican Republic | 0.2 /100 | #301 | Tragic 3.4% |
| Malaysians | 0.2 /100 | #302 | Tragic 3.4% |
| Immigrants | Haiti | 0.2 /100 | #303 | Tragic 3.4% |
| Cajuns | 0.2 /100 | #304 | Tragic 3.4% |
| Chickasaw | 0.1 /100 | #305 | Tragic 3.4% |
| Cape Verdeans | 0.1 /100 | #306 | Tragic 3.4% |
| Samoans | 0.1 /100 | #307 | Tragic 3.3% |
| Shoshone | 0.1 /100 | #308 | Tragic 3.3% |
| Pima | 0.1 /100 | #309 | Tragic 3.3% |
| Immigrants | Latin America | 0.1 /100 | #310 | Tragic 3.3% |
| Cherokee | 0.1 /100 | #311 | Tragic 3.3% |
| Sioux | 0.1 /100 | #312 | Tragic 3.3% |
Demographics Similar to Belgians by Professional Degree
In terms of professional degree, the demographic groups most similar to Belgians are Welsh (4.3%, a difference of 0.060%), Scotch-Irish (4.3%, a difference of 0.32%), Immigrants from Cameroon (4.3%, a difference of 0.47%), Immigrants from Thailand (4.3%, a difference of 0.75%), and Slovak (4.3%, a difference of 0.92%).
| Demographics | Rating | Rank | Professional Degree |
| Celtics | 47.6 /100 | #177 | Average 4.4% |
| Immigrants | Costa Rica | 46.7 /100 | #178 | Average 4.4% |
| Immigrants | Kenya | 45.9 /100 | #179 | Average 4.4% |
| Czechs | 44.9 /100 | #180 | Average 4.4% |
| Danes | 43.5 /100 | #181 | Average 4.4% |
| Immigrants | Immigrants | 43.2 /100 | #182 | Average 4.4% |
| Bermudans | 43.1 /100 | #183 | Average 4.4% |
| Belgians | 36.2 /100 | #184 | Fair 4.3% |
| Welsh | 35.8 /100 | #185 | Fair 4.3% |
| Scotch-Irish | 34.2 /100 | #186 | Fair 4.3% |
| Immigrants | Cameroon | 33.3 /100 | #187 | Fair 4.3% |
| Immigrants | Thailand | 31.7 /100 | #188 | Fair 4.3% |
| Slovaks | 30.7 /100 | #189 | Fair 4.3% |
| Immigrants | Poland | 29.2 /100 | #190 | Fair 4.3% |
| Sri Lankans | 29.0 /100 | #191 | Fair 4.3% |