Burmese vs Yugoslavian No Schooling Completed
COMPARE
Burmese
Yugoslavian
No Schooling Completed
No Schooling Completed Comparison
Burmese
Yugoslavians
1.9%
NO SCHOOLING COMPLETED
88.2/ 100
METRIC RATING
136th/ 347
METRIC RANK
1.8%
NO SCHOOLING COMPLETED
97.2/ 100
METRIC RATING
107th/ 347
METRIC RANK
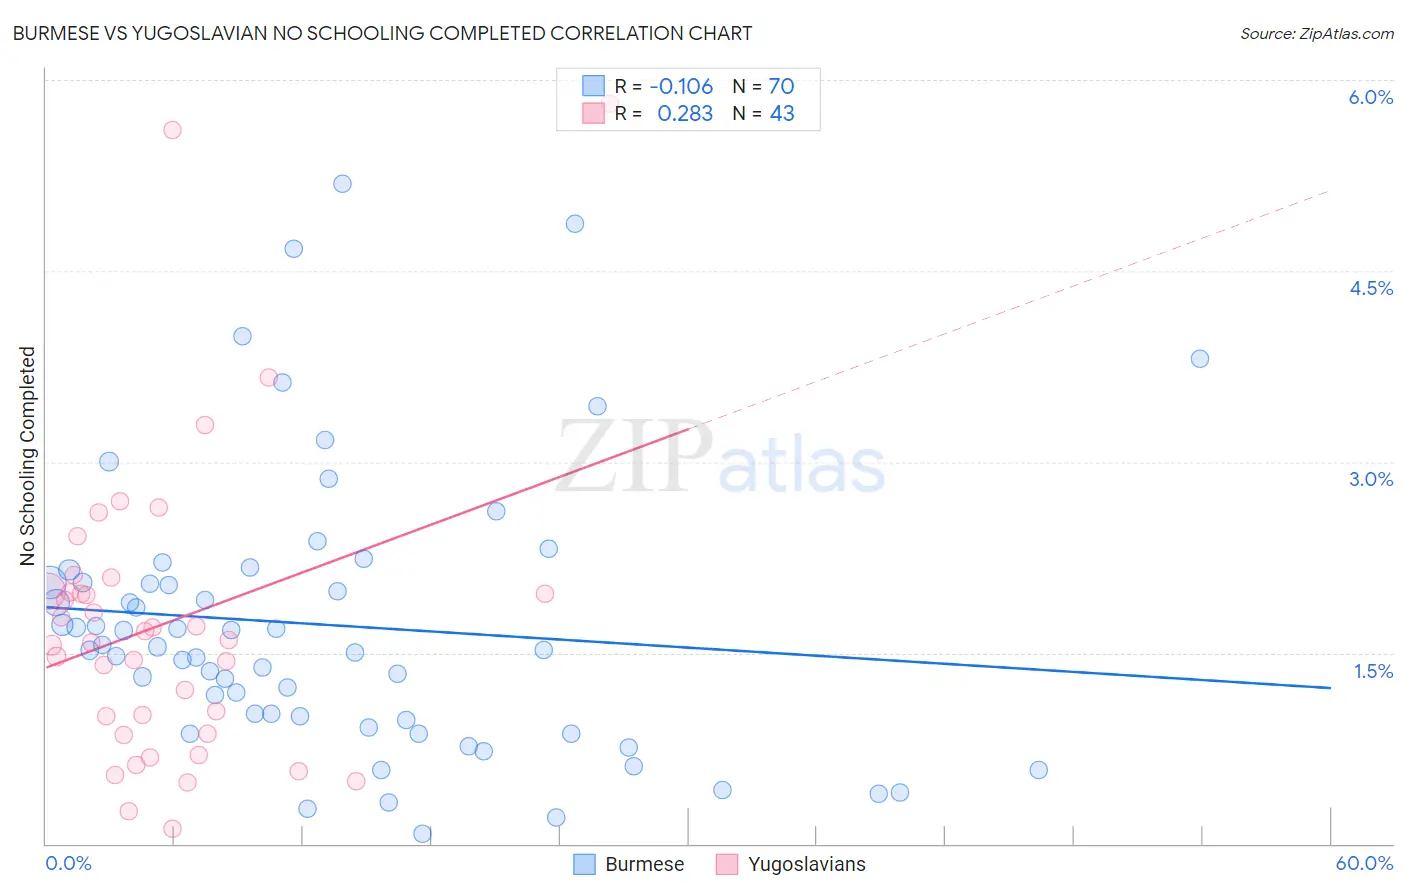
Burmese vs Yugoslavian No Schooling Completed Correlation Chart
The statistical analysis conducted on geographies consisting of 458,309,119 people shows a poor negative correlation between the proportion of Burmese and percentage of population with no schooling in the United States with a correlation coefficient (R) of -0.106 and weighted average of 1.9%. Similarly, the statistical analysis conducted on geographies consisting of 283,637,771 people shows a weak positive correlation between the proportion of Yugoslavians and percentage of population with no schooling in the United States with a correlation coefficient (R) of 0.283 and weighted average of 1.8%, a difference of 5.9%.
No Schooling Completed Correlation Summary
| Measurement | Burmese | Yugoslavian |
| Minimum | 0.081% | 0.12% |
| Maximum | 5.2% | 5.8% |
| Range | 5.1% | 5.7% |
| Mean | 1.7% | 1.7% |
| Median | 1.5% | 1.6% |
| Interquartile 25% (IQ1) | 0.98% | 0.86% |
| Interquartile 75% (IQ3) | 2.1% | 2.0% |
| Interquartile Range (IQR) | 1.1% | 1.1% |
| Standard Deviation (Sample) | 1.1% | 1.2% |
| Standard Deviation (Population) | 1.1% | 1.2% |
Similar Demographics by No Schooling Completed
Demographics Similar to Burmese by No Schooling Completed
In terms of no schooling completed, the demographic groups most similar to Burmese are Hmong (1.9%, a difference of 0.090%), Menominee (1.9%, a difference of 0.49%), Immigrants from Turkey (1.9%, a difference of 0.74%), Colville (1.9%, a difference of 0.84%), and Filipino (2.0%, a difference of 0.86%).
| Demographics | Rating | Rank | No Schooling Completed |
| Seminole | 92.0 /100 | #129 | Exceptional 1.9% |
| Palestinians | 91.8 /100 | #130 | Exceptional 1.9% |
| Immigrants | Hungary | 91.6 /100 | #131 | Exceptional 1.9% |
| Colville | 90.4 /100 | #132 | Exceptional 1.9% |
| Immigrants | Turkey | 90.2 /100 | #133 | Exceptional 1.9% |
| Menominee | 89.6 /100 | #134 | Excellent 1.9% |
| Hmong | 88.5 /100 | #135 | Excellent 1.9% |
| Burmese | 88.2 /100 | #136 | Excellent 1.9% |
| Filipinos | 85.5 /100 | #137 | Excellent 2.0% |
| Immigrants | Israel | 85.4 /100 | #138 | Excellent 2.0% |
| Jordanians | 84.5 /100 | #139 | Excellent 2.0% |
| Marshallese | 83.5 /100 | #140 | Excellent 2.0% |
| Immigrants | Greece | 83.5 /100 | #141 | Excellent 2.0% |
| Venezuelans | 81.5 /100 | #142 | Excellent 2.0% |
| Immigrants | South Central Asia | 80.0 /100 | #143 | Good 2.0% |
Demographics Similar to Yugoslavians by No Schooling Completed
In terms of no schooling completed, the demographic groups most similar to Yugoslavians are Immigrants from France (1.8%, a difference of 0.040%), Okinawan (1.8%, a difference of 0.22%), German Russian (1.8%, a difference of 0.44%), Thai (1.8%, a difference of 0.46%), and Immigrants from Saudi Arabia (1.9%, a difference of 0.57%).
| Demographics | Rating | Rank | No Schooling Completed |
| Immigrants | Singapore | 98.0 /100 | #100 | Exceptional 1.8% |
| Immigrants | Czechoslovakia | 97.9 /100 | #101 | Exceptional 1.8% |
| Immigrants | Switzerland | 97.9 /100 | #102 | Exceptional 1.8% |
| Basques | 97.9 /100 | #103 | Exceptional 1.8% |
| Thais | 97.5 /100 | #104 | Exceptional 1.8% |
| German Russians | 97.5 /100 | #105 | Exceptional 1.8% |
| Immigrants | France | 97.3 /100 | #106 | Exceptional 1.8% |
| Yugoslavians | 97.2 /100 | #107 | Exceptional 1.8% |
| Okinawans | 97.1 /100 | #108 | Exceptional 1.8% |
| Immigrants | Saudi Arabia | 96.8 /100 | #109 | Exceptional 1.9% |
| Immigrants | Latvia | 96.7 /100 | #110 | Exceptional 1.9% |
| Immigrants | Japan | 96.6 /100 | #111 | Exceptional 1.9% |
| Pueblo | 96.4 /100 | #112 | Exceptional 1.9% |
| Immigrants | Zimbabwe | 96.2 /100 | #113 | Exceptional 1.9% |
| Immigrants | Norway | 96.1 /100 | #114 | Exceptional 1.9% |