Arab vs Hmong College, 1 year or more
COMPARE
Arab
Hmong
College, 1 year or more
College, 1 year or more Comparison
Arabs
Hmong
61.6%
COLLEGE, 1 YEAR OR MORE
93.9/ 100
METRIC RATING
117th/ 347
METRIC RANK
57.2%
COLLEGE, 1 YEAR OR MORE
5.4/ 100
METRIC RATING
224th/ 347
METRIC RANK
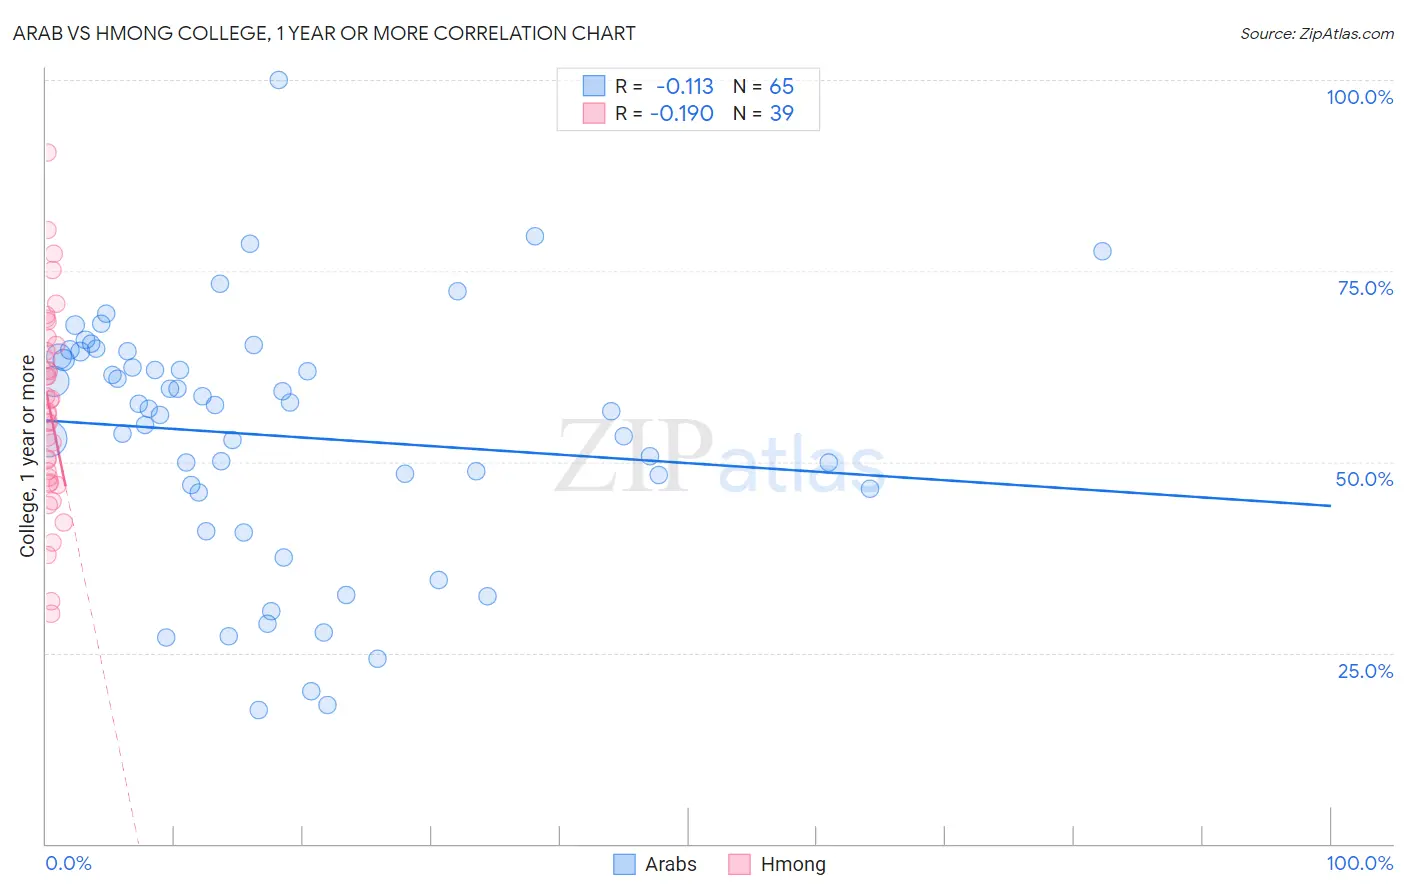
Arab vs Hmong College, 1 year or more Correlation Chart
The statistical analysis conducted on geographies consisting of 486,868,588 people shows a poor negative correlation between the proportion of Arabs and percentage of population with at least college, 1 year or more education in the United States with a correlation coefficient (R) of -0.113 and weighted average of 61.6%. Similarly, the statistical analysis conducted on geographies consisting of 24,680,511 people shows a poor negative correlation between the proportion of Hmong and percentage of population with at least college, 1 year or more education in the United States with a correlation coefficient (R) of -0.190 and weighted average of 57.2%, a difference of 7.7%.
College, 1 year or more Correlation Summary
| Measurement | Arab | Hmong |
| Minimum | 17.6% | 30.1% |
| Maximum | 100.0% | 90.4% |
| Range | 82.4% | 60.4% |
| Mean | 53.4% | 56.9% |
| Median | 57.0% | 56.5% |
| Interquartile 25% (IQ1) | 46.2% | 47.3% |
| Interquartile 75% (IQ3) | 64.1% | 65.3% |
| Interquartile Range (IQR) | 17.9% | 18.0% |
| Standard Deviation (Sample) | 16.3% | 13.1% |
| Standard Deviation (Population) | 16.2% | 12.9% |
Similar Demographics by College, 1 year or more
Demographics Similar to Arabs by College, 1 year or more
In terms of college, 1 year or more, the demographic groups most similar to Arabs are Immigrants from Brazil (61.6%, a difference of 0.0%), Lebanese (61.6%, a difference of 0.040%), Norwegian (61.7%, a difference of 0.14%), Assyrian/Chaldean/Syriac (61.5%, a difference of 0.14%), and Pakistani (61.5%, a difference of 0.14%).
| Demographics | Rating | Rank | College, 1 year or more |
| Europeans | 95.6 /100 | #110 | Exceptional 61.8% |
| Macedonians | 95.6 /100 | #111 | Exceptional 61.8% |
| Austrians | 95.4 /100 | #112 | Exceptional 61.8% |
| Ukrainians | 95.2 /100 | #113 | Exceptional 61.8% |
| Danes | 94.8 /100 | #114 | Exceptional 61.7% |
| Norwegians | 94.5 /100 | #115 | Exceptional 61.7% |
| Lebanese | 94.1 /100 | #116 | Exceptional 61.6% |
| Arabs | 93.9 /100 | #117 | Exceptional 61.6% |
| Immigrants | Brazil | 93.9 /100 | #118 | Exceptional 61.6% |
| Assyrians/Chaldeans/Syriacs | 93.3 /100 | #119 | Exceptional 61.5% |
| Pakistanis | 93.2 /100 | #120 | Exceptional 61.5% |
| Immigrants | Jordan | 92.7 /100 | #121 | Exceptional 61.4% |
| Immigrants | Chile | 92.3 /100 | #122 | Exceptional 61.4% |
| Serbians | 92.2 /100 | #123 | Exceptional 61.4% |
| Venezuelans | 92.1 /100 | #124 | Exceptional 61.3% |
Demographics Similar to Hmong by College, 1 year or more
In terms of college, 1 year or more, the demographic groups most similar to Hmong are Portuguese (57.2%, a difference of 0.0%), Subsaharan African (57.3%, a difference of 0.17%), Vietnamese (57.0%, a difference of 0.21%), Immigrants from Western Africa (57.0%, a difference of 0.23%), and Immigrants (57.0%, a difference of 0.30%).
| Demographics | Rating | Rank | College, 1 year or more |
| Immigrants | Panama | 9.1 /100 | #217 | Tragic 57.6% |
| Native Hawaiians | 9.0 /100 | #218 | Tragic 57.6% |
| Whites/Caucasians | 8.7 /100 | #219 | Tragic 57.6% |
| Immigrants | Costa Rica | 8.0 /100 | #220 | Tragic 57.5% |
| Immigrants | Ghana | 7.7 /100 | #221 | Tragic 57.4% |
| Sub-Saharan Africans | 6.1 /100 | #222 | Tragic 57.3% |
| Portuguese | 5.4 /100 | #223 | Tragic 57.2% |
| Hmong | 5.4 /100 | #224 | Tragic 57.2% |
| Vietnamese | 4.7 /100 | #225 | Tragic 57.0% |
| Immigrants | Western Africa | 4.6 /100 | #226 | Tragic 57.0% |
| Immigrants | Immigrants | 4.4 /100 | #227 | Tragic 57.0% |
| Immigrants | Fiji | 4.0 /100 | #228 | Tragic 56.9% |
| Cree | 3.6 /100 | #229 | Tragic 56.8% |
| Liberians | 3.1 /100 | #230 | Tragic 56.7% |
| Immigrants | Burma/Myanmar | 2.7 /100 | #231 | Tragic 56.6% |