Central American vs Russian College, Under 1 year
COMPARE
Central American
Russian
College, Under 1 year
College, Under 1 year Comparison
Central Americans
Russians
57.7%
COLLEGE, UNDER 1 YEAR
0.0/ 100
METRIC RATING
308th/ 347
METRIC RANK
70.5%
COLLEGE, UNDER 1 YEAR
99.9/ 100
METRIC RATING
35th/ 347
METRIC RANK
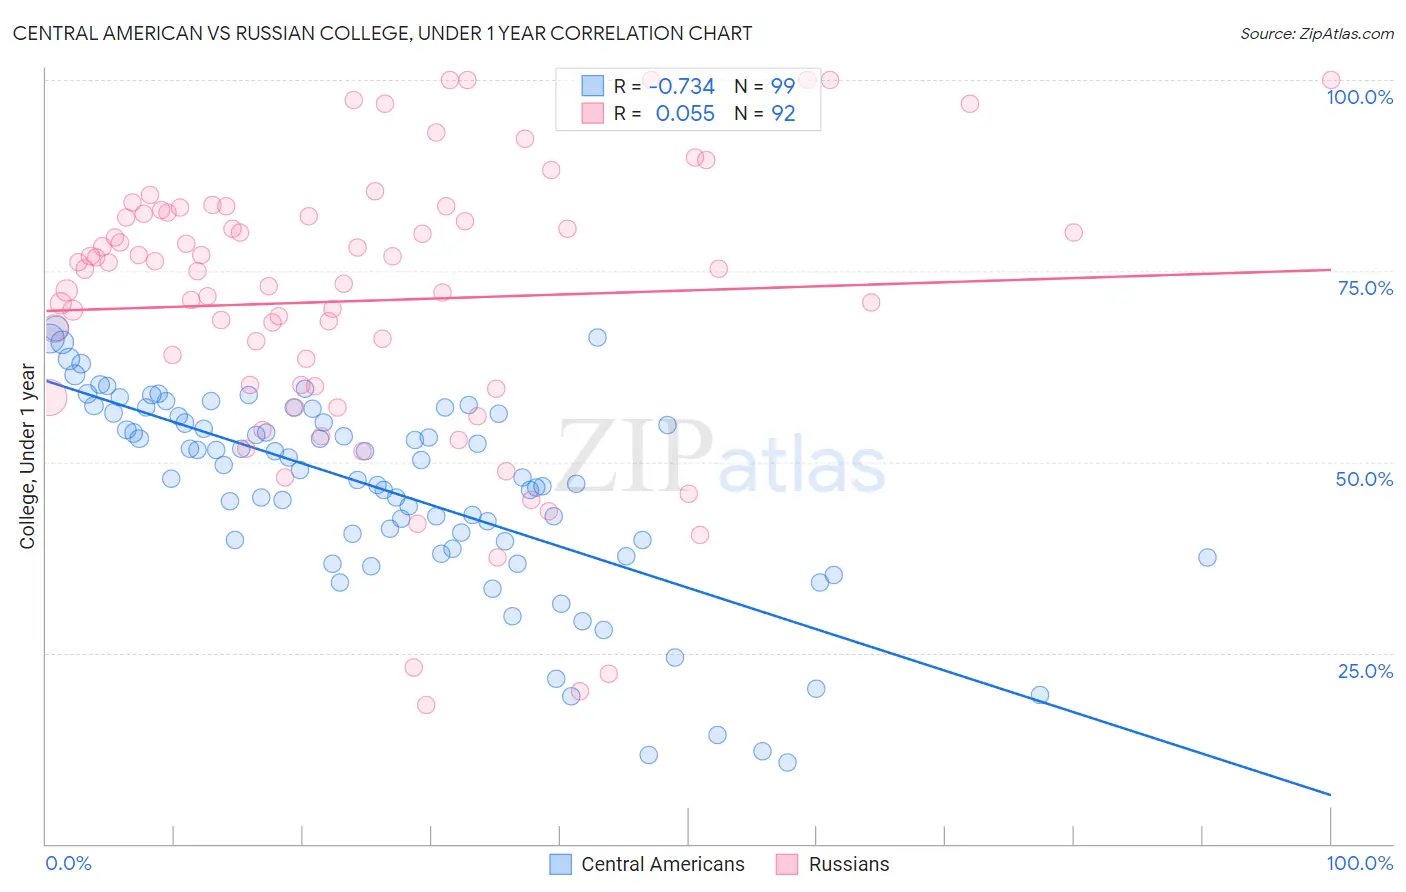
Central American vs Russian College, Under 1 year Correlation Chart
The statistical analysis conducted on geographies consisting of 504,615,987 people shows a strong negative correlation between the proportion of Central Americans and percentage of population with at least college, under 1 year education in the United States with a correlation coefficient (R) of -0.734 and weighted average of 57.7%. Similarly, the statistical analysis conducted on geographies consisting of 512,255,371 people shows a slight positive correlation between the proportion of Russians and percentage of population with at least college, under 1 year education in the United States with a correlation coefficient (R) of 0.055 and weighted average of 70.5%, a difference of 22.3%.
College, Under 1 year Correlation Summary
| Measurement | Central American | Russian |
| Minimum | 10.7% | 18.2% |
| Maximum | 67.5% | 100.0% |
| Range | 56.8% | 81.8% |
| Mean | 46.4% | 71.1% |
| Median | 48.9% | 75.2% |
| Interquartile 25% (IQ1) | 39.6% | 60.0% |
| Interquartile 75% (IQ3) | 56.3% | 82.5% |
| Interquartile Range (IQR) | 16.7% | 22.5% |
| Standard Deviation (Sample) | 13.0% | 18.5% |
| Standard Deviation (Population) | 12.9% | 18.4% |
Similar Demographics by College, Under 1 year
Demographics Similar to Central Americans by College, Under 1 year
In terms of college, under 1 year, the demographic groups most similar to Central Americans are Fijian (57.7%, a difference of 0.0%), Immigrants from Portugal (57.7%, a difference of 0.010%), Immigrants from Nicaragua (57.6%, a difference of 0.12%), Haitian (57.8%, a difference of 0.21%), and Kiowa (57.8%, a difference of 0.32%).
| Demographics | Rating | Rank | College, Under 1 year |
| Mexican American Indians | 0.0 /100 | #301 | Tragic 58.1% |
| Apache | 0.0 /100 | #302 | Tragic 58.0% |
| Immigrants | Dominica | 0.0 /100 | #303 | Tragic 57.9% |
| Kiowa | 0.0 /100 | #304 | Tragic 57.8% |
| Haitians | 0.0 /100 | #305 | Tragic 57.8% |
| Immigrants | Portugal | 0.0 /100 | #306 | Tragic 57.7% |
| Fijians | 0.0 /100 | #307 | Tragic 57.7% |
| Central Americans | 0.0 /100 | #308 | Tragic 57.7% |
| Immigrants | Nicaragua | 0.0 /100 | #309 | Tragic 57.6% |
| Pueblo | 0.0 /100 | #310 | Tragic 57.4% |
| Cajuns | 0.0 /100 | #311 | Tragic 57.3% |
| Salvadorans | 0.0 /100 | #312 | Tragic 57.3% |
| Dutch West Indians | 0.0 /100 | #313 | Tragic 57.2% |
| Hopi | 0.0 /100 | #314 | Tragic 57.1% |
| Hondurans | 0.0 /100 | #315 | Tragic 57.1% |
Demographics Similar to Russians by College, Under 1 year
In terms of college, under 1 year, the demographic groups most similar to Russians are Immigrants from Sri Lanka (70.5%, a difference of 0.060%), Estonian (70.6%, a difference of 0.080%), Immigrants from South Africa (70.6%, a difference of 0.10%), Immigrants from Saudi Arabia (70.4%, a difference of 0.17%), and Australian (70.4%, a difference of 0.25%).
| Demographics | Rating | Rank | College, Under 1 year |
| Immigrants | Hong Kong | 100.0 /100 | #28 | Exceptional 71.0% |
| Immigrants | France | 100.0 /100 | #29 | Exceptional 71.0% |
| Immigrants | China | 99.9 /100 | #30 | Exceptional 70.9% |
| Indians (Asian) | 99.9 /100 | #31 | Exceptional 70.8% |
| Turks | 99.9 /100 | #32 | Exceptional 70.7% |
| Immigrants | South Africa | 99.9 /100 | #33 | Exceptional 70.6% |
| Estonians | 99.9 /100 | #34 | Exceptional 70.6% |
| Russians | 99.9 /100 | #35 | Exceptional 70.5% |
| Immigrants | Sri Lanka | 99.9 /100 | #36 | Exceptional 70.5% |
| Immigrants | Saudi Arabia | 99.9 /100 | #37 | Exceptional 70.4% |
| Australians | 99.9 /100 | #38 | Exceptional 70.4% |
| Bhutanese | 99.9 /100 | #39 | Exceptional 70.3% |
| Immigrants | Turkey | 99.9 /100 | #40 | Exceptional 70.3% |
| Immigrants | Kuwait | 99.9 /100 | #41 | Exceptional 70.3% |
| Immigrants | Lithuania | 99.9 /100 | #42 | Exceptional 70.3% |