Zimbabwean vs Basque College, Under 1 year
COMPARE
Zimbabwean
Basque
College, Under 1 year
College, Under 1 year Comparison
Zimbabweans
Basques
69.9%
COLLEGE, UNDER 1 YEAR
99.8/ 100
METRIC RATING
50th/ 347
METRIC RANK
67.6%
COLLEGE, UNDER 1 YEAR
95.2/ 100
METRIC RATING
115th/ 347
METRIC RANK
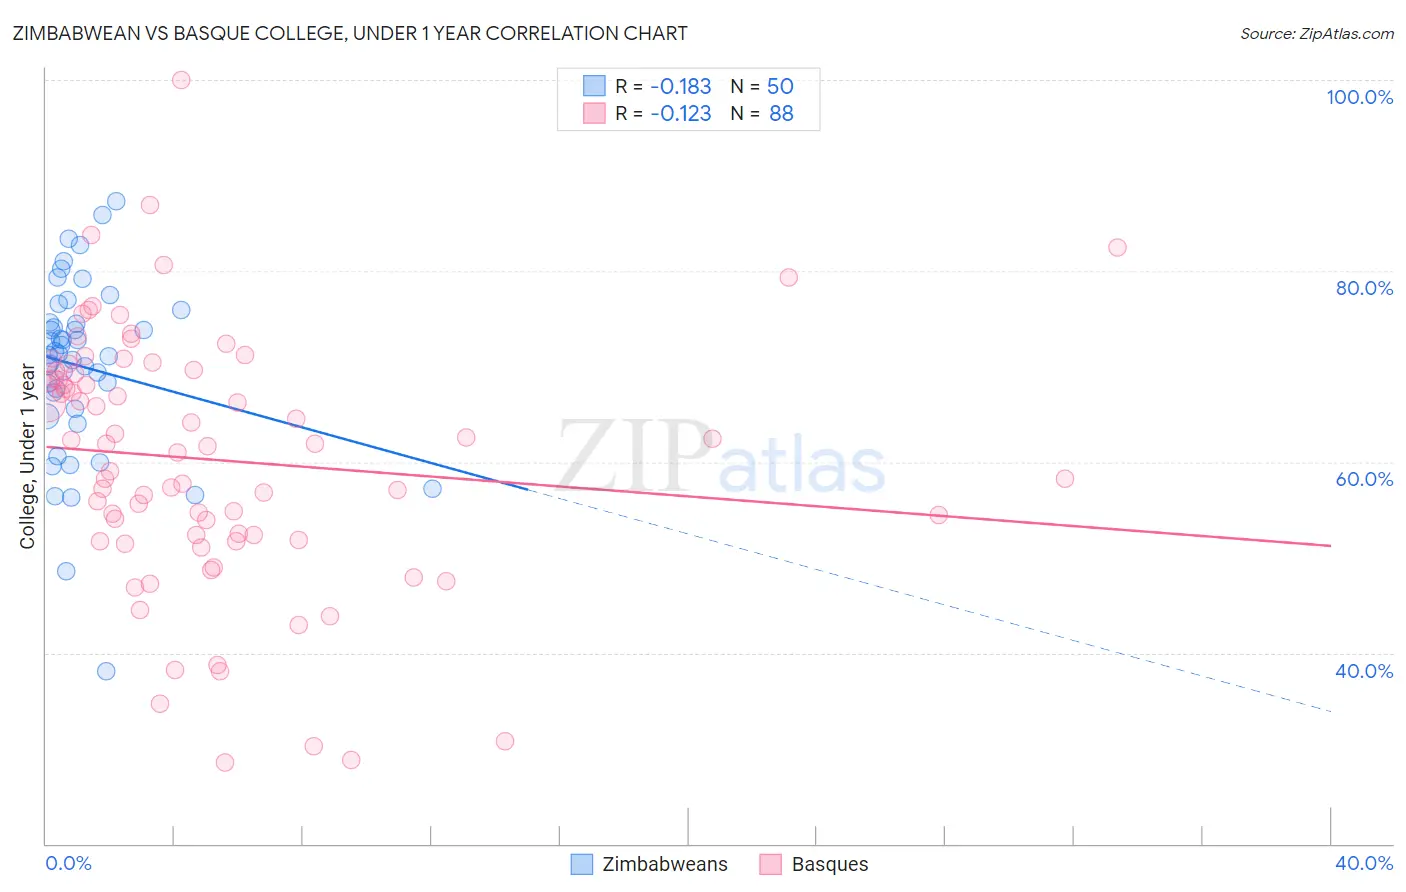
Zimbabwean vs Basque College, Under 1 year Correlation Chart
The statistical analysis conducted on geographies consisting of 69,203,226 people shows a poor negative correlation between the proportion of Zimbabweans and percentage of population with at least college, under 1 year education in the United States with a correlation coefficient (R) of -0.183 and weighted average of 69.9%. Similarly, the statistical analysis conducted on geographies consisting of 165,778,801 people shows a poor negative correlation between the proportion of Basques and percentage of population with at least college, under 1 year education in the United States with a correlation coefficient (R) of -0.123 and weighted average of 67.6%, a difference of 3.4%.
College, Under 1 year Correlation Summary
| Measurement | Zimbabwean | Basque |
| Minimum | 38.0% | 28.6% |
| Maximum | 87.3% | 100.0% |
| Range | 49.3% | 71.4% |
| Mean | 69.9% | 60.2% |
| Median | 71.3% | 61.8% |
| Interquartile 25% (IQ1) | 65.6% | 52.1% |
| Interquartile 75% (IQ3) | 74.6% | 69.4% |
| Interquartile Range (IQR) | 9.0% | 17.3% |
| Standard Deviation (Sample) | 9.4% | 13.5% |
| Standard Deviation (Population) | 9.3% | 13.4% |
Similar Demographics by College, Under 1 year
Demographics Similar to Zimbabweans by College, Under 1 year
In terms of college, under 1 year, the demographic groups most similar to Zimbabweans are Mongolian (69.9%, a difference of 0.040%), Immigrants from Russia (69.9%, a difference of 0.060%), Immigrants from Austria (70.0%, a difference of 0.12%), Immigrants from Netherlands (70.0%, a difference of 0.16%), and Immigrants from Bulgaria (70.0%, a difference of 0.22%).
| Demographics | Rating | Rank | College, Under 1 year |
| Israelis | 99.9 /100 | #43 | Exceptional 70.2% |
| New Zealanders | 99.9 /100 | #44 | Exceptional 70.2% |
| Immigrants | Norway | 99.9 /100 | #45 | Exceptional 70.2% |
| Immigrants | Latvia | 99.9 /100 | #46 | Exceptional 70.1% |
| Immigrants | Bulgaria | 99.8 /100 | #47 | Exceptional 70.0% |
| Immigrants | Netherlands | 99.8 /100 | #48 | Exceptional 70.0% |
| Immigrants | Austria | 99.8 /100 | #49 | Exceptional 70.0% |
| Zimbabweans | 99.8 /100 | #50 | Exceptional 69.9% |
| Mongolians | 99.8 /100 | #51 | Exceptional 69.9% |
| Immigrants | Russia | 99.8 /100 | #52 | Exceptional 69.9% |
| South Africans | 99.7 /100 | #53 | Exceptional 69.7% |
| Immigrants | Czechoslovakia | 99.7 /100 | #54 | Exceptional 69.6% |
| Maltese | 99.7 /100 | #55 | Exceptional 69.5% |
| Immigrants | Scotland | 99.6 /100 | #56 | Exceptional 69.4% |
| Asians | 99.6 /100 | #57 | Exceptional 69.4% |
Demographics Similar to Basques by College, Under 1 year
In terms of college, under 1 year, the demographic groups most similar to Basques are Chilean (67.6%, a difference of 0.010%), Immigrants from Nepal (67.5%, a difference of 0.080%), Syrian (67.6%, a difference of 0.090%), Pakistani (67.5%, a difference of 0.10%), and Macedonian (67.6%, a difference of 0.11%).
| Demographics | Rating | Rank | College, Under 1 year |
| Immigrants | Egypt | 96.0 /100 | #108 | Exceptional 67.7% |
| Scandinavians | 95.8 /100 | #109 | Exceptional 67.7% |
| Assyrians/Chaldeans/Syriacs | 95.8 /100 | #110 | Exceptional 67.7% |
| Ukrainians | 95.8 /100 | #111 | Exceptional 67.7% |
| Macedonians | 95.7 /100 | #112 | Exceptional 67.6% |
| Syrians | 95.6 /100 | #113 | Exceptional 67.6% |
| Chileans | 95.3 /100 | #114 | Exceptional 67.6% |
| Basques | 95.2 /100 | #115 | Exceptional 67.6% |
| Immigrants | Nepal | 94.9 /100 | #116 | Exceptional 67.5% |
| Pakistanis | 94.8 /100 | #117 | Exceptional 67.5% |
| Immigrants | Ukraine | 94.7 /100 | #118 | Exceptional 67.5% |
| Lebanese | 94.6 /100 | #119 | Exceptional 67.5% |
| Serbians | 93.9 /100 | #120 | Exceptional 67.4% |
| Slovenes | 93.3 /100 | #121 | Exceptional 67.3% |
| Immigrants | Jordan | 92.8 /100 | #122 | Exceptional 67.3% |