Immigrants from Dominica vs Dominican High School Diploma
COMPARE
Immigrants from Dominica
Dominican
High School Diploma
High School Diploma Comparison
Immigrants from Dominica
Dominicans
85.2%
HIGH SCHOOL DIPLOMA
0.0/ 100
METRIC RATING
309th/ 347
METRIC RANK
82.9%
HIGH SCHOOL DIPLOMA
0.0/ 100
METRIC RATING
328th/ 347
METRIC RANK
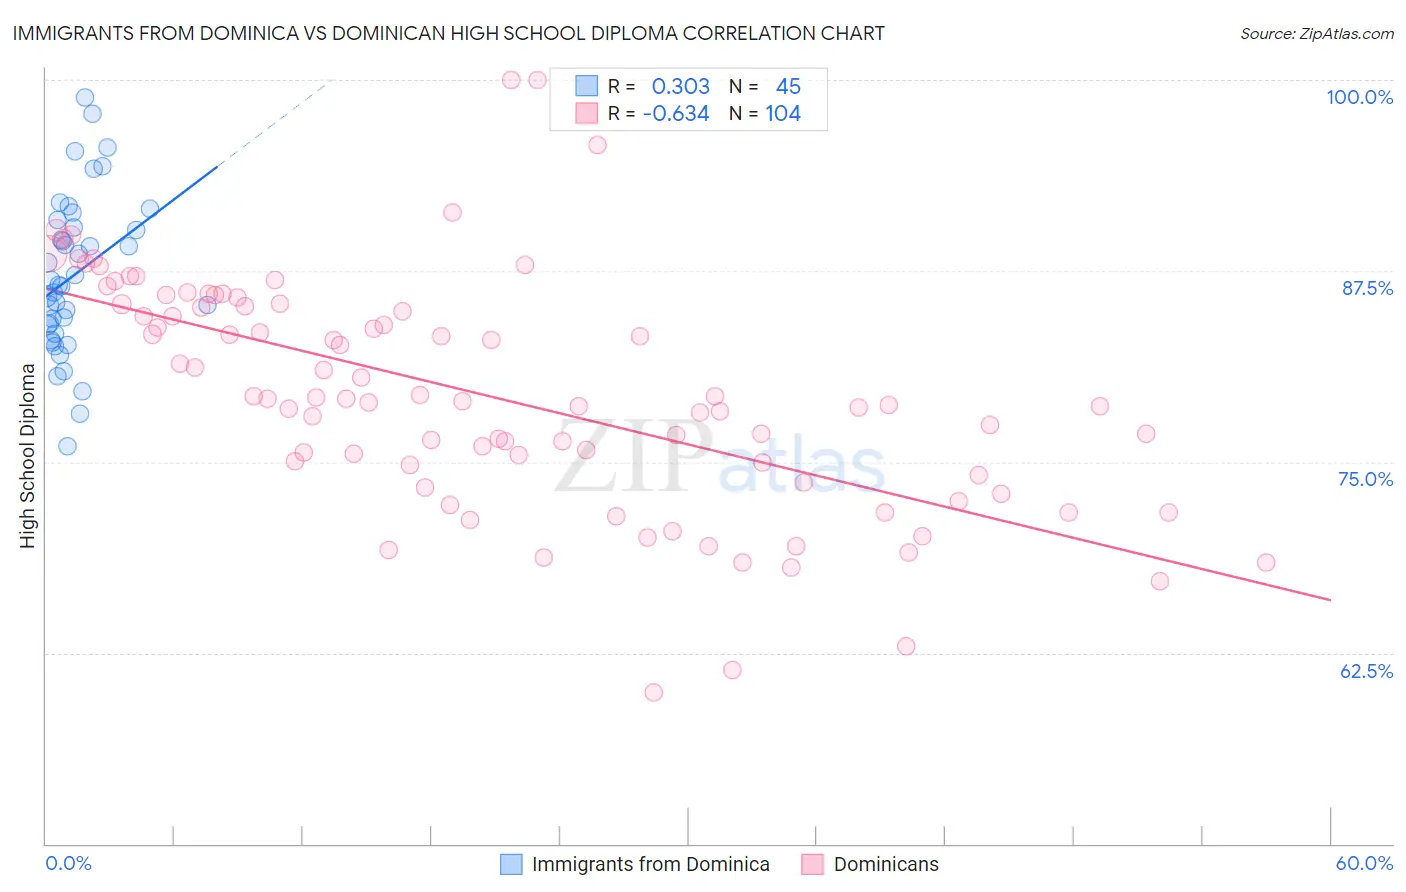
Immigrants from Dominica vs Dominican High School Diploma Correlation Chart
The statistical analysis conducted on geographies consisting of 83,794,115 people shows a mild positive correlation between the proportion of Immigrants from Dominica and percentage of population with at least high school diploma education in the United States with a correlation coefficient (R) of 0.303 and weighted average of 85.2%. Similarly, the statistical analysis conducted on geographies consisting of 355,143,036 people shows a significant negative correlation between the proportion of Dominicans and percentage of population with at least high school diploma education in the United States with a correlation coefficient (R) of -0.634 and weighted average of 82.9%, a difference of 2.7%.
High School Diploma Correlation Summary
| Measurement | Immigrants from Dominica | Dominican |
| Minimum | 76.0% | 59.9% |
| Maximum | 98.8% | 100.0% |
| Range | 22.8% | 40.1% |
| Mean | 87.2% | 79.4% |
| Median | 86.5% | 79.0% |
| Interquartile 25% (IQ1) | 83.7% | 74.5% |
| Interquartile 75% (IQ3) | 90.6% | 85.3% |
| Interquartile Range (IQR) | 6.9% | 10.8% |
| Standard Deviation (Sample) | 5.1% | 7.6% |
| Standard Deviation (Population) | 5.0% | 7.6% |
Demographics Similar to Immigrants from Dominica and Dominicans by High School Diploma
In terms of high school diploma, the demographic groups most similar to Immigrants from Dominica are Immigrants from Armenia (85.2%, a difference of 0.020%), Apache (85.1%, a difference of 0.080%), Ecuadorian (85.1%, a difference of 0.090%), Cape Verdean (85.1%, a difference of 0.14%), and Immigrants from Ecuador (84.8%, a difference of 0.39%). Similarly, the demographic groups most similar to Dominicans are Honduran (83.0%, a difference of 0.050%), Mexican American Indian (83.0%, a difference of 0.090%), Immigrants from Nicaragua (83.1%, a difference of 0.16%), Immigrants from Cabo Verde (83.3%, a difference of 0.39%), and Immigrants from Cuba (83.5%, a difference of 0.68%).
| Demographics | Rating | Rank | High School Diploma |
| Immigrants | Armenia | 0.0 /100 | #308 | Tragic 85.2% |
| Immigrants | Dominica | 0.0 /100 | #309 | Tragic 85.2% |
| Apache | 0.0 /100 | #310 | Tragic 85.1% |
| Ecuadorians | 0.0 /100 | #311 | Tragic 85.1% |
| Cape Verdeans | 0.0 /100 | #312 | Tragic 85.1% |
| Immigrants | Ecuador | 0.0 /100 | #313 | Tragic 84.8% |
| Yaqui | 0.0 /100 | #314 | Tragic 84.7% |
| Puerto Ricans | 0.0 /100 | #315 | Tragic 84.7% |
| Belizeans | 0.0 /100 | #316 | Tragic 84.3% |
| Immigrants | Caribbean | 0.0 /100 | #317 | Tragic 84.3% |
| Immigrants | Belize | 0.0 /100 | #318 | Tragic 84.2% |
| Central American Indians | 0.0 /100 | #319 | Tragic 84.2% |
| Nicaraguans | 0.0 /100 | #320 | Tragic 84.1% |
| Yuman | 0.0 /100 | #321 | Tragic 84.0% |
| Lumbee | 0.0 /100 | #322 | Tragic 83.6% |
| Immigrants | Cuba | 0.0 /100 | #323 | Tragic 83.5% |
| Immigrants | Cabo Verde | 0.0 /100 | #324 | Tragic 83.3% |
| Immigrants | Nicaragua | 0.0 /100 | #325 | Tragic 83.1% |
| Mexican American Indians | 0.0 /100 | #326 | Tragic 83.0% |
| Hondurans | 0.0 /100 | #327 | Tragic 83.0% |
| Dominicans | 0.0 /100 | #328 | Tragic 82.9% |