Celtic vs U.S. Virgin Islander Professional Degree
COMPARE
Celtic
U.S. Virgin Islander
Professional Degree
Professional Degree Comparison
Celtics
U.S. Virgin Islanders
4.4%
PROFESSIONAL DEGREE
47.6/ 100
METRIC RATING
177th/ 347
METRIC RANK
3.7%
PROFESSIONAL DEGREE
1.0/ 100
METRIC RATING
262nd/ 347
METRIC RANK
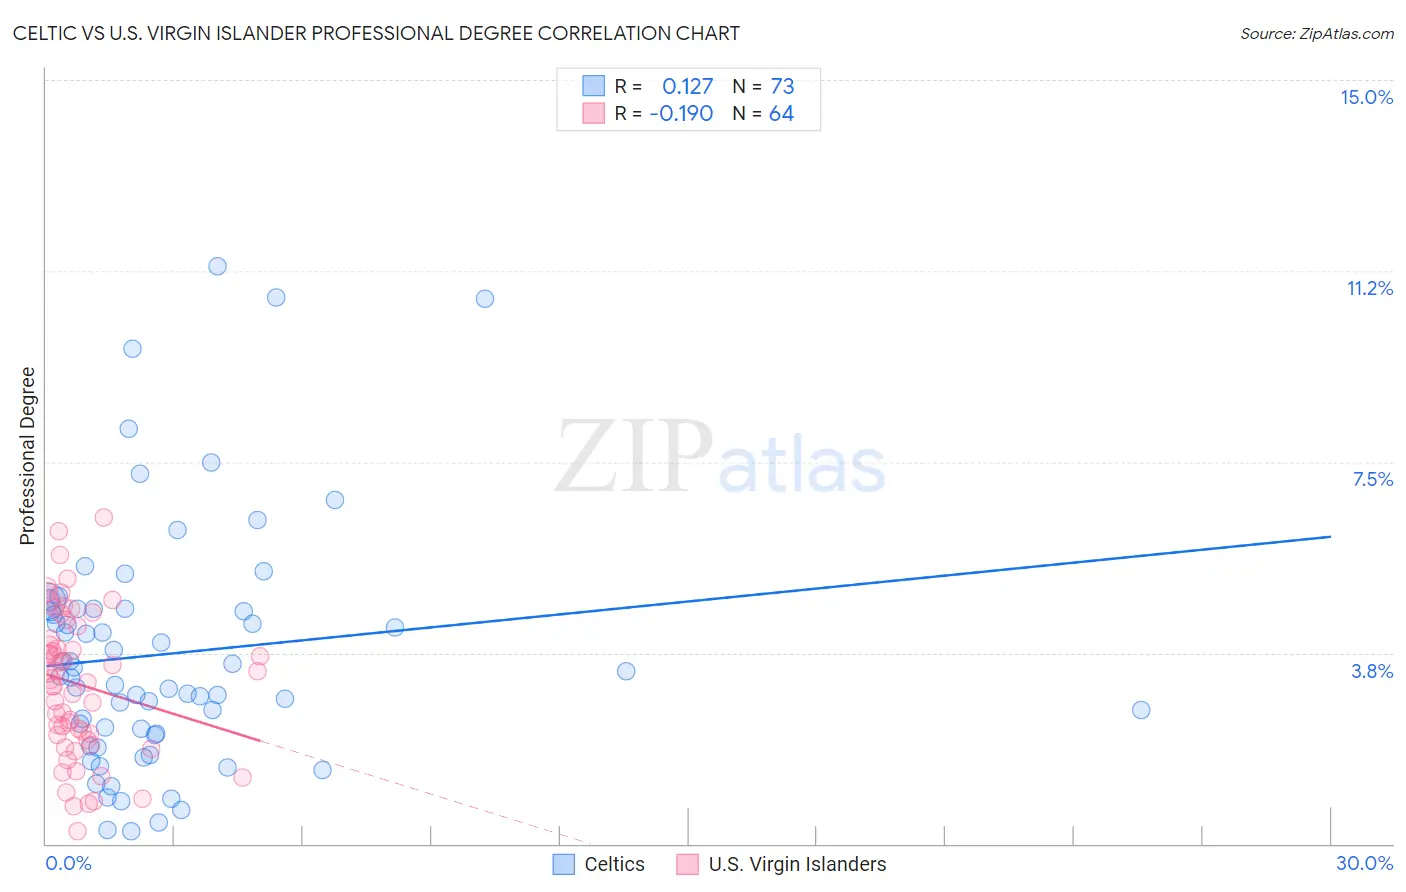
Celtic vs U.S. Virgin Islander Professional Degree Correlation Chart
The statistical analysis conducted on geographies consisting of 168,640,863 people shows a poor positive correlation between the proportion of Celtics and percentage of population with at least professional degree education in the United States with a correlation coefficient (R) of 0.127 and weighted average of 4.4%. Similarly, the statistical analysis conducted on geographies consisting of 87,432,219 people shows a poor negative correlation between the proportion of U.S. Virgin Islanders and percentage of population with at least professional degree education in the United States with a correlation coefficient (R) of -0.190 and weighted average of 3.7%, a difference of 19.8%.
Professional Degree Correlation Summary
| Measurement | Celtic | U.S. Virgin Islander |
| Minimum | 0.25% | 0.26% |
| Maximum | 11.4% | 6.4% |
| Range | 11.1% | 6.1% |
| Mean | 3.7% | 3.1% |
| Median | 3.3% | 3.2% |
| Interquartile 25% (IQ1) | 2.2% | 2.1% |
| Interquartile 75% (IQ3) | 4.6% | 4.1% |
| Interquartile Range (IQR) | 2.5% | 2.1% |
| Standard Deviation (Sample) | 2.4% | 1.4% |
| Standard Deviation (Population) | 2.4% | 1.4% |
Similar Demographics by Professional Degree
Demographics Similar to Celtics by Professional Degree
In terms of professional degree, the demographic groups most similar to Celtics are Immigrants from Costa Rica (4.4%, a difference of 0.13%), Immigrants from Kenya (4.4%, a difference of 0.24%), Immigrants from Peru (4.4%, a difference of 0.25%), Kenyan (4.4%, a difference of 0.35%), and Irish (4.4%, a difference of 0.35%).
| Demographics | Rating | Rank | Professional Degree |
| Immigrants | Zaire | 57.4 /100 | #170 | Average 4.5% |
| Immigrants | Bangladesh | 56.0 /100 | #171 | Average 4.4% |
| Spaniards | 52.0 /100 | #172 | Average 4.4% |
| English | 50.1 /100 | #173 | Average 4.4% |
| Kenyans | 50.0 /100 | #174 | Average 4.4% |
| Irish | 50.0 /100 | #175 | Average 4.4% |
| Immigrants | Peru | 49.3 /100 | #176 | Average 4.4% |
| Celtics | 47.6 /100 | #177 | Average 4.4% |
| Immigrants | Costa Rica | 46.7 /100 | #178 | Average 4.4% |
| Immigrants | Kenya | 45.9 /100 | #179 | Average 4.4% |
| Czechs | 44.9 /100 | #180 | Average 4.4% |
| Danes | 43.5 /100 | #181 | Average 4.4% |
| Immigrants | Immigrants | 43.2 /100 | #182 | Average 4.4% |
| Bermudans | 43.1 /100 | #183 | Average 4.4% |
| Belgians | 36.2 /100 | #184 | Fair 4.3% |
Demographics Similar to U.S. Virgin Islanders by Professional Degree
In terms of professional degree, the demographic groups most similar to U.S. Virgin Islanders are Immigrants from Guyana (3.7%, a difference of 0.010%), Indonesian (3.7%, a difference of 0.19%), African (3.7%, a difference of 0.20%), Immigrants from St. Vincent and the Grenadines (3.7%, a difference of 0.42%), and Bahamian (3.7%, a difference of 0.50%).
| Demographics | Rating | Rank | Professional Degree |
| Osage | 1.2 /100 | #255 | Tragic 3.7% |
| Iroquois | 1.2 /100 | #256 | Tragic 3.7% |
| Bahamians | 1.1 /100 | #257 | Tragic 3.7% |
| Immigrants | St. Vincent and the Grenadines | 1.1 /100 | #258 | Tragic 3.7% |
| Africans | 1.0 /100 | #259 | Tragic 3.7% |
| Indonesians | 1.0 /100 | #260 | Tragic 3.7% |
| Immigrants | Guyana | 1.0 /100 | #261 | Tragic 3.7% |
| U.S. Virgin Islanders | 1.0 /100 | #262 | Tragic 3.7% |
| Hopi | 0.9 /100 | #263 | Tragic 3.6% |
| Immigrants | Cambodia | 0.9 /100 | #264 | Tragic 3.6% |
| Immigrants | Congo | 0.8 /100 | #265 | Tragic 3.6% |
| Central American Indians | 0.8 /100 | #266 | Tragic 3.6% |
| Delaware | 0.7 /100 | #267 | Tragic 3.6% |
| Aleuts | 0.7 /100 | #268 | Tragic 3.6% |
| Immigrants | Cuba | 0.6 /100 | #269 | Tragic 3.6% |