Celtic vs Mongolian Professional Degree
COMPARE
Celtic
Mongolian
Professional Degree
Professional Degree Comparison
Celtics
Mongolians
4.4%
PROFESSIONAL DEGREE
47.6/ 100
METRIC RATING
177th/ 347
METRIC RANK
6.1%
PROFESSIONAL DEGREE
100.0/ 100
METRIC RATING
34th/ 347
METRIC RANK
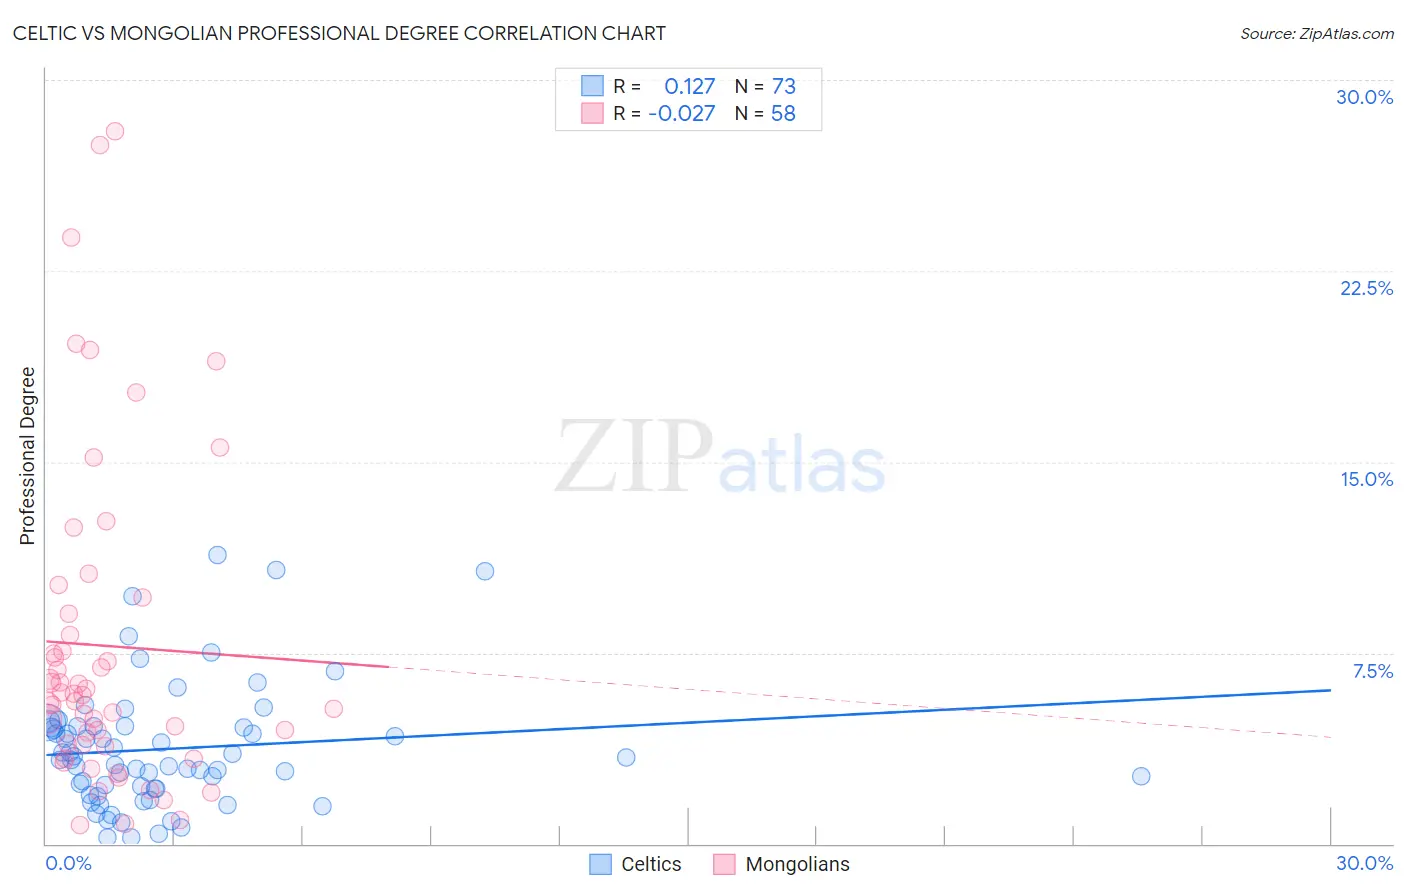
Celtic vs Mongolian Professional Degree Correlation Chart
The statistical analysis conducted on geographies consisting of 168,640,863 people shows a poor positive correlation between the proportion of Celtics and percentage of population with at least professional degree education in the United States with a correlation coefficient (R) of 0.127 and weighted average of 4.4%. Similarly, the statistical analysis conducted on geographies consisting of 140,296,057 people shows no correlation between the proportion of Mongolians and percentage of population with at least professional degree education in the United States with a correlation coefficient (R) of -0.027 and weighted average of 6.1%, a difference of 39.7%.
Professional Degree Correlation Summary
| Measurement | Celtic | Mongolian |
| Minimum | 0.25% | 0.72% |
| Maximum | 11.4% | 28.0% |
| Range | 11.1% | 27.3% |
| Mean | 3.7% | 7.8% |
| Median | 3.3% | 5.9% |
| Interquartile 25% (IQ1) | 2.2% | 3.9% |
| Interquartile 75% (IQ3) | 4.6% | 9.0% |
| Interquartile Range (IQR) | 2.5% | 5.1% |
| Standard Deviation (Sample) | 2.4% | 6.4% |
| Standard Deviation (Population) | 2.4% | 6.3% |
Similar Demographics by Professional Degree
Demographics Similar to Celtics by Professional Degree
In terms of professional degree, the demographic groups most similar to Celtics are Immigrants from Costa Rica (4.4%, a difference of 0.13%), Immigrants from Kenya (4.4%, a difference of 0.24%), Immigrants from Peru (4.4%, a difference of 0.25%), Kenyan (4.4%, a difference of 0.35%), and Irish (4.4%, a difference of 0.35%).
| Demographics | Rating | Rank | Professional Degree |
| Immigrants | Zaire | 57.4 /100 | #170 | Average 4.5% |
| Immigrants | Bangladesh | 56.0 /100 | #171 | Average 4.4% |
| Spaniards | 52.0 /100 | #172 | Average 4.4% |
| English | 50.1 /100 | #173 | Average 4.4% |
| Kenyans | 50.0 /100 | #174 | Average 4.4% |
| Irish | 50.0 /100 | #175 | Average 4.4% |
| Immigrants | Peru | 49.3 /100 | #176 | Average 4.4% |
| Celtics | 47.6 /100 | #177 | Average 4.4% |
| Immigrants | Costa Rica | 46.7 /100 | #178 | Average 4.4% |
| Immigrants | Kenya | 45.9 /100 | #179 | Average 4.4% |
| Czechs | 44.9 /100 | #180 | Average 4.4% |
| Danes | 43.5 /100 | #181 | Average 4.4% |
| Immigrants | Immigrants | 43.2 /100 | #182 | Average 4.4% |
| Bermudans | 43.1 /100 | #183 | Average 4.4% |
| Belgians | 36.2 /100 | #184 | Fair 4.3% |
Demographics Similar to Mongolians by Professional Degree
In terms of professional degree, the demographic groups most similar to Mongolians are Burmese (6.1%, a difference of 0.13%), Thai (6.1%, a difference of 0.17%), Immigrants from India (6.2%, a difference of 0.40%), Immigrants from Sri Lanka (6.2%, a difference of 0.52%), and Immigrants from Turkey (6.2%, a difference of 0.52%).
| Demographics | Rating | Rank | Professional Degree |
| Immigrants | Northern Europe | 100.0 /100 | #27 | Exceptional 6.2% |
| Turks | 100.0 /100 | #28 | Exceptional 6.2% |
| Immigrants | Sri Lanka | 100.0 /100 | #29 | Exceptional 6.2% |
| Immigrants | Turkey | 100.0 /100 | #30 | Exceptional 6.2% |
| Immigrants | India | 100.0 /100 | #31 | Exceptional 6.2% |
| Thais | 100.0 /100 | #32 | Exceptional 6.1% |
| Burmese | 100.0 /100 | #33 | Exceptional 6.1% |
| Mongolians | 100.0 /100 | #34 | Exceptional 6.1% |
| Immigrants | Korea | 100.0 /100 | #35 | Exceptional 6.1% |
| Immigrants | Russia | 100.0 /100 | #36 | Exceptional 6.0% |
| Immigrants | Austria | 100.0 /100 | #37 | Exceptional 6.0% |
| Immigrants | Norway | 100.0 /100 | #38 | Exceptional 6.0% |
| Immigrants | South Africa | 100.0 /100 | #39 | Exceptional 6.0% |
| Cambodians | 100.0 /100 | #40 | Exceptional 6.0% |
| New Zealanders | 100.0 /100 | #41 | Exceptional 6.0% |