Celtic vs Immigrants from Nigeria Professional Degree
COMPARE
Celtic
Immigrants from Nigeria
Professional Degree
Professional Degree Comparison
Celtics
Immigrants from Nigeria
4.4%
PROFESSIONAL DEGREE
47.6/ 100
METRIC RATING
177th/ 347
METRIC RANK
4.1%
PROFESSIONAL DEGREE
11.7/ 100
METRIC RATING
210th/ 347
METRIC RANK
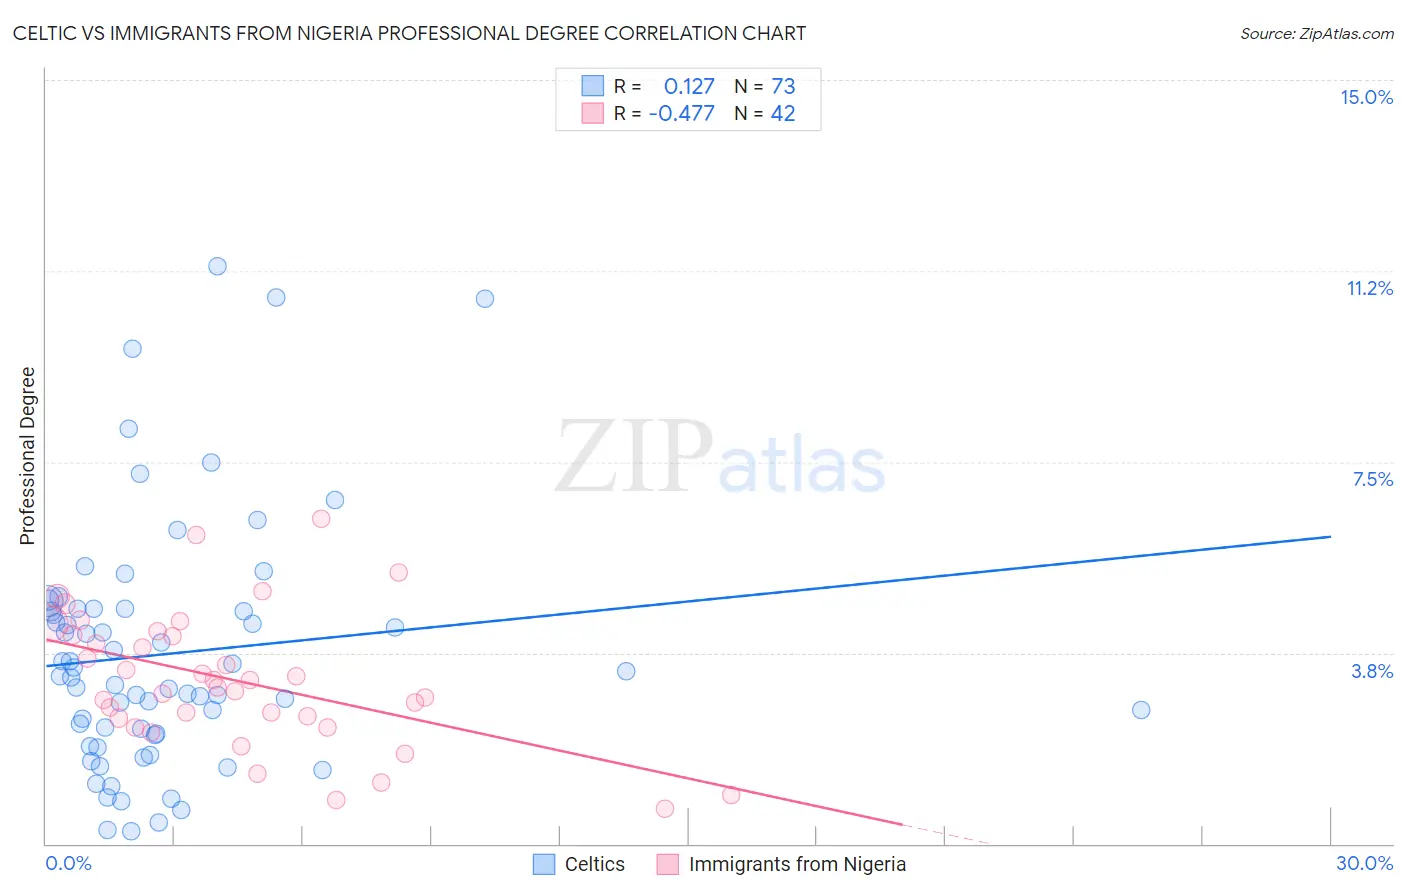
Celtic vs Immigrants from Nigeria Professional Degree Correlation Chart
The statistical analysis conducted on geographies consisting of 168,640,863 people shows a poor positive correlation between the proportion of Celtics and percentage of population with at least professional degree education in the United States with a correlation coefficient (R) of 0.127 and weighted average of 4.4%. Similarly, the statistical analysis conducted on geographies consisting of 283,120,883 people shows a moderate negative correlation between the proportion of Immigrants from Nigeria and percentage of population with at least professional degree education in the United States with a correlation coefficient (R) of -0.477 and weighted average of 4.1%, a difference of 7.5%.
Professional Degree Correlation Summary
| Measurement | Celtic | Immigrants from Nigeria |
| Minimum | 0.25% | 0.69% |
| Maximum | 11.4% | 6.4% |
| Range | 11.1% | 5.7% |
| Mean | 3.7% | 3.2% |
| Median | 3.3% | 3.1% |
| Interquartile 25% (IQ1) | 2.2% | 2.5% |
| Interquartile 75% (IQ3) | 4.6% | 4.1% |
| Interquartile Range (IQR) | 2.5% | 1.6% |
| Standard Deviation (Sample) | 2.4% | 1.3% |
| Standard Deviation (Population) | 2.4% | 1.3% |
Similar Demographics by Professional Degree
Demographics Similar to Celtics by Professional Degree
In terms of professional degree, the demographic groups most similar to Celtics are Immigrants from Costa Rica (4.4%, a difference of 0.13%), Immigrants from Kenya (4.4%, a difference of 0.24%), Immigrants from Peru (4.4%, a difference of 0.25%), Kenyan (4.4%, a difference of 0.35%), and Irish (4.4%, a difference of 0.35%).
| Demographics | Rating | Rank | Professional Degree |
| Immigrants | Zaire | 57.4 /100 | #170 | Average 4.5% |
| Immigrants | Bangladesh | 56.0 /100 | #171 | Average 4.4% |
| Spaniards | 52.0 /100 | #172 | Average 4.4% |
| English | 50.1 /100 | #173 | Average 4.4% |
| Kenyans | 50.0 /100 | #174 | Average 4.4% |
| Irish | 50.0 /100 | #175 | Average 4.4% |
| Immigrants | Peru | 49.3 /100 | #176 | Average 4.4% |
| Celtics | 47.6 /100 | #177 | Average 4.4% |
| Immigrants | Costa Rica | 46.7 /100 | #178 | Average 4.4% |
| Immigrants | Kenya | 45.9 /100 | #179 | Average 4.4% |
| Czechs | 44.9 /100 | #180 | Average 4.4% |
| Danes | 43.5 /100 | #181 | Average 4.4% |
| Immigrants | Immigrants | 43.2 /100 | #182 | Average 4.4% |
| Bermudans | 43.1 /100 | #183 | Average 4.4% |
| Belgians | 36.2 /100 | #184 | Fair 4.3% |
Demographics Similar to Immigrants from Nigeria by Professional Degree
In terms of professional degree, the demographic groups most similar to Immigrants from Nigeria are German (4.1%, a difference of 0.030%), White/Caucasian (4.1%, a difference of 0.21%), Immigrants from Panama (4.1%, a difference of 0.22%), Immigrants from Somalia (4.1%, a difference of 0.30%), and Subsaharan African (4.1%, a difference of 0.38%).
| Demographics | Rating | Rank | Professional Degree |
| Panamanians | 15.9 /100 | #203 | Poor 4.1% |
| Barbadians | 15.8 /100 | #204 | Poor 4.1% |
| Somalis | 14.8 /100 | #205 | Poor 4.1% |
| Yugoslavians | 13.4 /100 | #206 | Poor 4.1% |
| Sub-Saharan Africans | 12.8 /100 | #207 | Poor 4.1% |
| Immigrants | Somalia | 12.5 /100 | #208 | Poor 4.1% |
| Immigrants | Panama | 12.3 /100 | #209 | Poor 4.1% |
| Immigrants | Nigeria | 11.7 /100 | #210 | Poor 4.1% |
| Germans | 11.6 /100 | #211 | Poor 4.1% |
| Whites/Caucasians | 11.2 /100 | #212 | Poor 4.1% |
| Koreans | 10.7 /100 | #213 | Poor 4.1% |
| Immigrants | Ghana | 10.6 /100 | #214 | Poor 4.1% |
| Portuguese | 10.5 /100 | #215 | Poor 4.1% |
| West Indians | 9.8 /100 | #216 | Tragic 4.1% |
| Immigrants | Vietnam | 9.4 /100 | #217 | Tragic 4.0% |