Celtic vs Korean Doctorate Degree
COMPARE
Celtic
Korean
Doctorate Degree
Doctorate Degree Comparison
Celtics
Koreans
1.9%
DOCTORATE DEGREE
66.7/ 100
METRIC RATING
164th/ 347
METRIC RANK
1.7%
DOCTORATE DEGREE
14.2/ 100
METRIC RATING
213th/ 347
METRIC RANK
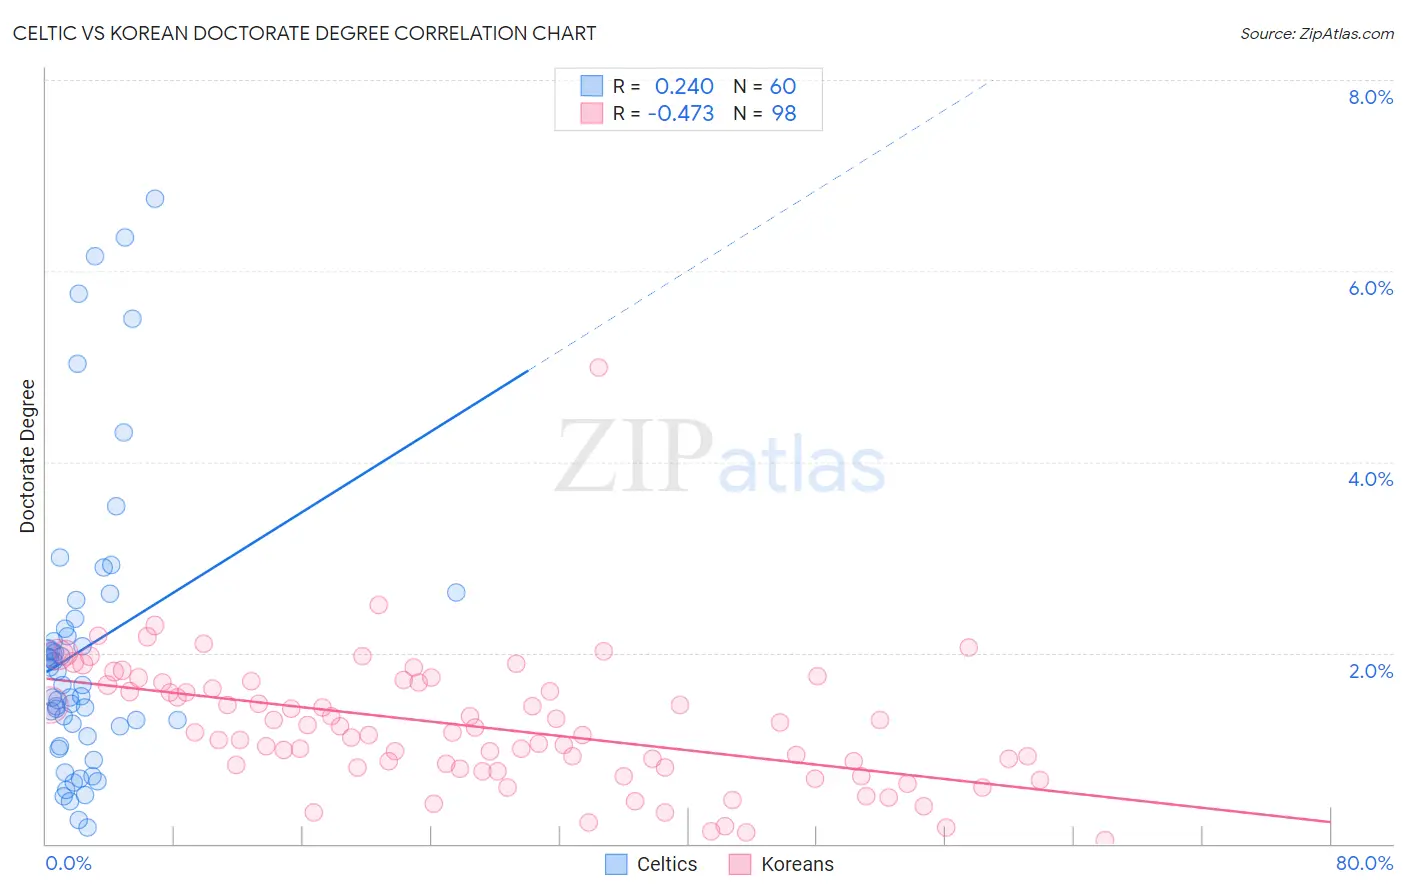
Celtic vs Korean Doctorate Degree Correlation Chart
The statistical analysis conducted on geographies consisting of 167,913,023 people shows a weak positive correlation between the proportion of Celtics and percentage of population with at least doctorate degree education in the United States with a correlation coefficient (R) of 0.240 and weighted average of 1.9%. Similarly, the statistical analysis conducted on geographies consisting of 500,370,759 people shows a moderate negative correlation between the proportion of Koreans and percentage of population with at least doctorate degree education in the United States with a correlation coefficient (R) of -0.473 and weighted average of 1.7%, a difference of 9.8%.
Doctorate Degree Correlation Summary
| Measurement | Celtic | Korean |
| Minimum | 0.17% | 0.043% |
| Maximum | 6.8% | 5.0% |
| Range | 6.6% | 4.9% |
| Mean | 2.1% | 1.2% |
| Median | 1.7% | 1.2% |
| Interquartile 25% (IQ1) | 1.2% | 0.80% |
| Interquartile 75% (IQ3) | 2.3% | 1.7% |
| Interquartile Range (IQR) | 1.1% | 0.88% |
| Standard Deviation (Sample) | 1.5% | 0.69% |
| Standard Deviation (Population) | 1.5% | 0.68% |
Similar Demographics by Doctorate Degree
Demographics Similar to Celtics by Doctorate Degree
In terms of doctorate degree, the demographic groups most similar to Celtics are Czech (1.9%, a difference of 0.10%), Irish (1.9%, a difference of 0.13%), Immigrants from Middle Africa (1.9%, a difference of 0.35%), Scotch-Irish (1.9%, a difference of 0.49%), and Welsh (1.9%, a difference of 0.50%).
| Demographics | Rating | Rank | Doctorate Degree |
| Danes | 71.9 /100 | #157 | Good 1.9% |
| Hungarians | 71.7 /100 | #158 | Good 1.9% |
| Slovenes | 70.2 /100 | #159 | Good 1.9% |
| Welsh | 69.7 /100 | #160 | Good 1.9% |
| Immigrants | Middle Africa | 68.8 /100 | #161 | Good 1.9% |
| Irish | 67.5 /100 | #162 | Good 1.9% |
| Czechs | 67.3 /100 | #163 | Good 1.9% |
| Celtics | 66.7 /100 | #164 | Good 1.9% |
| Scotch-Irish | 63.6 /100 | #165 | Good 1.9% |
| Spaniards | 63.5 /100 | #166 | Good 1.9% |
| Macedonians | 60.9 /100 | #167 | Good 1.9% |
| Sri Lankans | 60.3 /100 | #168 | Good 1.9% |
| Vietnamese | 54.8 /100 | #169 | Average 1.9% |
| Costa Ricans | 53.3 /100 | #170 | Average 1.8% |
| Bermudans | 52.1 /100 | #171 | Average 1.8% |
Demographics Similar to Koreans by Doctorate Degree
In terms of doctorate degree, the demographic groups most similar to Koreans are Pueblo (1.7%, a difference of 0.010%), Immigrants from South Eastern Asia (1.7%, a difference of 0.15%), Alaskan Athabascan (1.7%, a difference of 0.15%), Immigrants from Burma/Myanmar (1.7%, a difference of 0.25%), and Immigrants from Armenia (1.7%, a difference of 0.27%).
| Demographics | Rating | Rank | Doctorate Degree |
| Immigrants | Peru | 17.6 /100 | #206 | Poor 1.7% |
| Yugoslavians | 17.1 /100 | #207 | Poor 1.7% |
| Colombians | 16.1 /100 | #208 | Poor 1.7% |
| Immigrants | Western Africa | 15.4 /100 | #209 | Poor 1.7% |
| Tongans | 15.1 /100 | #210 | Poor 1.7% |
| Immigrants | Armenia | 15.1 /100 | #211 | Poor 1.7% |
| Immigrants | South Eastern Asia | 14.7 /100 | #212 | Poor 1.7% |
| Koreans | 14.2 /100 | #213 | Poor 1.7% |
| Pueblo | 14.2 /100 | #214 | Poor 1.7% |
| Alaskan Athabascans | 13.8 /100 | #215 | Poor 1.7% |
| Immigrants | Burma/Myanmar | 13.5 /100 | #216 | Poor 1.7% |
| Spanish Americans | 12.9 /100 | #217 | Poor 1.7% |
| Tlingit-Haida | 11.9 /100 | #218 | Poor 1.7% |
| Immigrants | Iraq | 10.7 /100 | #219 | Poor 1.7% |
| Immigrants | Uruguay | 9.2 /100 | #220 | Tragic 1.7% |