Carpatho Rusyn vs Immigrants from Japan 10th Grade
COMPARE
Carpatho Rusyn
Immigrants from Japan
10th Grade
10th Grade Comparison
Carpatho Rusyns
Immigrants from Japan
95.9%
10TH GRADE
100.0/ 100
METRIC RATING
5th/ 347
METRIC RANK
94.7%
10TH GRADE
99.0/ 100
METRIC RATING
88th/ 347
METRIC RANK
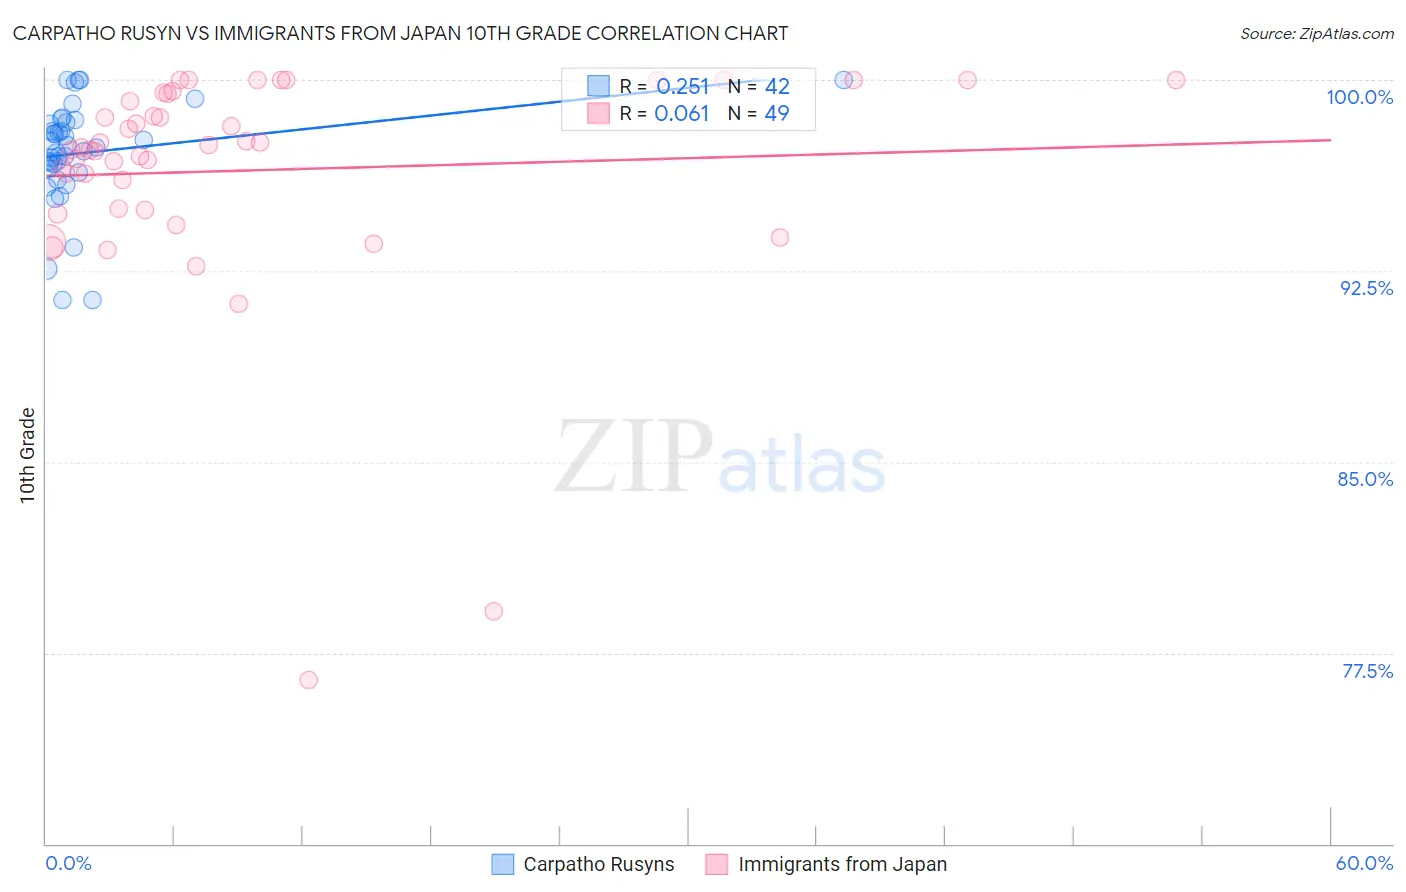
Carpatho Rusyn vs Immigrants from Japan 10th Grade Correlation Chart
The statistical analysis conducted on geographies consisting of 58,871,690 people shows a weak positive correlation between the proportion of Carpatho Rusyns and percentage of population with at least 10th grade education in the United States with a correlation coefficient (R) of 0.251 and weighted average of 95.9%. Similarly, the statistical analysis conducted on geographies consisting of 340,148,942 people shows a slight positive correlation between the proportion of Immigrants from Japan and percentage of population with at least 10th grade education in the United States with a correlation coefficient (R) of 0.061 and weighted average of 94.7%, a difference of 1.3%.
10th Grade Correlation Summary
| Measurement | Carpatho Rusyn | Immigrants from Japan |
| Minimum | 91.4% | 76.5% |
| Maximum | 100.0% | 100.0% |
| Range | 8.6% | 23.5% |
| Mean | 97.2% | 96.4% |
| Median | 97.4% | 97.3% |
| Interquartile 25% (IQ1) | 96.5% | 94.9% |
| Interquartile 75% (IQ3) | 98.3% | 99.5% |
| Interquartile Range (IQR) | 1.8% | 4.5% |
| Standard Deviation (Sample) | 2.1% | 4.5% |
| Standard Deviation (Population) | 2.0% | 4.5% |
Similar Demographics by 10th Grade
Demographics Similar to Carpatho Rusyns by 10th Grade
In terms of 10th grade, the demographic groups most similar to Carpatho Rusyns are Slovene (95.9%, a difference of 0.020%), Swedish (95.9%, a difference of 0.020%), Polish (95.8%, a difference of 0.10%), German (95.8%, a difference of 0.11%), and Slovak (96.0%, a difference of 0.12%).
| Demographics | Rating | Rank | 10th Grade |
| Norwegians | 100.0 /100 | #1 | Exceptional 96.2% |
| Slovaks | 100.0 /100 | #2 | Exceptional 96.0% |
| Slovenes | 100.0 /100 | #3 | Exceptional 95.9% |
| Swedes | 100.0 /100 | #4 | Exceptional 95.9% |
| Carpatho Rusyns | 100.0 /100 | #5 | Exceptional 95.9% |
| Poles | 100.0 /100 | #6 | Exceptional 95.8% |
| Germans | 100.0 /100 | #7 | Exceptional 95.8% |
| Lithuanians | 100.0 /100 | #8 | Exceptional 95.8% |
| Finns | 100.0 /100 | #9 | Exceptional 95.8% |
| Croatians | 100.0 /100 | #10 | Exceptional 95.7% |
| Danes | 100.0 /100 | #11 | Exceptional 95.7% |
| Tlingit-Haida | 100.0 /100 | #12 | Exceptional 95.7% |
| English | 100.0 /100 | #13 | Exceptional 95.6% |
| Tsimshian | 100.0 /100 | #14 | Exceptional 95.6% |
| Irish | 100.0 /100 | #15 | Exceptional 95.6% |
Demographics Similar to Immigrants from Japan by 10th Grade
In terms of 10th grade, the demographic groups most similar to Immigrants from Japan are Immigrants from Saudi Arabia (94.7%, a difference of 0.0%), Crow (94.7%, a difference of 0.010%), Puget Sound Salish (94.7%, a difference of 0.010%), Immigrants from Moldova (94.7%, a difference of 0.010%), and Icelander (94.7%, a difference of 0.020%).
| Demographics | Rating | Rank | 10th Grade |
| Immigrants | Latvia | 99.2 /100 | #81 | Exceptional 94.7% |
| Swiss | 99.1 /100 | #82 | Exceptional 94.7% |
| Immigrants | Western Europe | 99.1 /100 | #83 | Exceptional 94.7% |
| Icelanders | 99.1 /100 | #84 | Exceptional 94.7% |
| Crow | 99.0 /100 | #85 | Exceptional 94.7% |
| Puget Sound Salish | 99.0 /100 | #86 | Exceptional 94.7% |
| Immigrants | Saudi Arabia | 99.0 /100 | #87 | Exceptional 94.7% |
| Immigrants | Japan | 99.0 /100 | #88 | Exceptional 94.7% |
| Immigrants | Moldova | 98.9 /100 | #89 | Exceptional 94.7% |
| South Africans | 98.8 /100 | #90 | Exceptional 94.7% |
| Whites/Caucasians | 98.8 /100 | #91 | Exceptional 94.7% |
| Yugoslavians | 98.4 /100 | #92 | Exceptional 94.6% |
| Soviet Union | 98.3 /100 | #93 | Exceptional 94.6% |
| Immigrants | Germany | 98.3 /100 | #94 | Exceptional 94.6% |
| Menominee | 98.3 /100 | #95 | Exceptional 94.6% |