Celtic vs Mongolian 6th Grade
COMPARE
Celtic
Mongolian
6th Grade
6th Grade Comparison
Celtics
Mongolians
97.8%
6TH GRADE
99.9/ 100
METRIC RATING
48th/ 347
METRIC RANK
97.0%
6TH GRADE
46.7/ 100
METRIC RATING
177th/ 347
METRIC RANK
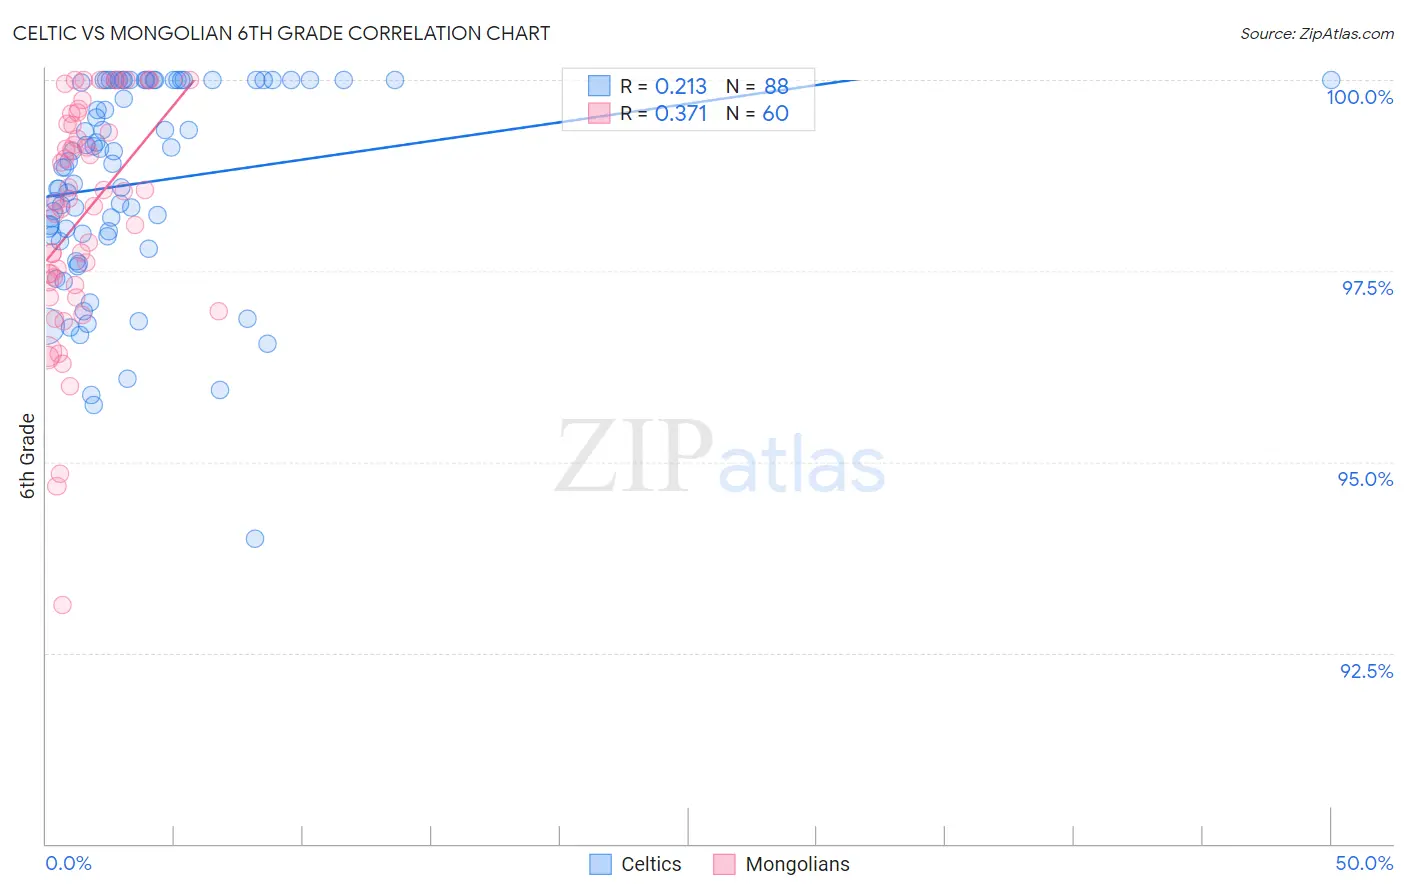
Celtic vs Mongolian 6th Grade Correlation Chart
The statistical analysis conducted on geographies consisting of 168,875,705 people shows a weak positive correlation between the proportion of Celtics and percentage of population with at least 6th grade education in the United States with a correlation coefficient (R) of 0.213 and weighted average of 97.8%. Similarly, the statistical analysis conducted on geographies consisting of 140,315,038 people shows a mild positive correlation between the proportion of Mongolians and percentage of population with at least 6th grade education in the United States with a correlation coefficient (R) of 0.371 and weighted average of 97.0%, a difference of 0.76%.
6th Grade Correlation Summary
| Measurement | Celtic | Mongolian |
| Minimum | 94.0% | 93.1% |
| Maximum | 100.0% | 100.0% |
| Range | 6.0% | 6.9% |
| Mean | 98.6% | 98.2% |
| Median | 98.9% | 98.4% |
| Interquartile 25% (IQ1) | 98.0% | 97.3% |
| Interquartile 75% (IQ3) | 100.0% | 99.4% |
| Interquartile Range (IQR) | 2.0% | 2.1% |
| Standard Deviation (Sample) | 1.3% | 1.5% |
| Standard Deviation (Population) | 1.3% | 1.5% |
Similar Demographics by 6th Grade
Demographics Similar to Celtics by 6th Grade
In terms of 6th grade, the demographic groups most similar to Celtics are Native Hawaiian (97.8%, a difference of 0.0%), Estonian (97.8%, a difference of 0.0%), Immigrants from Scotland (97.8%, a difference of 0.0%), Arapaho (97.8%, a difference of 0.010%), and Maltese (97.8%, a difference of 0.010%).
| Demographics | Rating | Rank | 6th Grade |
| Eastern Europeans | 99.9 /100 | #41 | Exceptional 97.9% |
| Hungarians | 99.9 /100 | #42 | Exceptional 97.8% |
| Northern Europeans | 99.9 /100 | #43 | Exceptional 97.8% |
| Czechoslovakians | 99.9 /100 | #44 | Exceptional 97.8% |
| Bulgarians | 99.9 /100 | #45 | Exceptional 97.8% |
| Arapaho | 99.9 /100 | #46 | Exceptional 97.8% |
| Native Hawaiians | 99.9 /100 | #47 | Exceptional 97.8% |
| Celtics | 99.9 /100 | #48 | Exceptional 97.8% |
| Estonians | 99.8 /100 | #49 | Exceptional 97.8% |
| Immigrants | Scotland | 99.8 /100 | #50 | Exceptional 97.8% |
| Maltese | 99.8 /100 | #51 | Exceptional 97.8% |
| Australians | 99.8 /100 | #52 | Exceptional 97.8% |
| Slavs | 99.8 /100 | #53 | Exceptional 97.8% |
| Creek | 99.8 /100 | #54 | Exceptional 97.7% |
| Aleuts | 99.8 /100 | #55 | Exceptional 97.7% |
Demographics Similar to Mongolians by 6th Grade
In terms of 6th grade, the demographic groups most similar to Mongolians are Immigrants from Kazakhstan (97.0%, a difference of 0.0%), Immigrants from Micronesia (97.0%, a difference of 0.0%), Pakistani (97.0%, a difference of 0.0%), Venezuelan (97.0%, a difference of 0.010%), and Immigrants from Kenya (97.0%, a difference of 0.010%).
| Demographics | Rating | Rank | 6th Grade |
| Chileans | 52.1 /100 | #170 | Average 97.1% |
| Immigrants | Sri Lanka | 51.7 /100 | #171 | Average 97.1% |
| Egyptians | 50.9 /100 | #172 | Average 97.1% |
| Arabs | 50.1 /100 | #173 | Average 97.0% |
| Venezuelans | 50.0 /100 | #174 | Average 97.0% |
| Immigrants | Kazakhstan | 47.3 /100 | #175 | Average 97.0% |
| Immigrants | Micronesia | 47.1 /100 | #176 | Average 97.0% |
| Mongolians | 46.7 /100 | #177 | Average 97.0% |
| Pakistanis | 46.0 /100 | #178 | Average 97.0% |
| Immigrants | Kenya | 45.3 /100 | #179 | Average 97.0% |
| Immigrants | Spain | 39.9 /100 | #180 | Fair 97.0% |
| Comanche | 37.9 /100 | #181 | Fair 97.0% |
| Immigrants | Ukraine | 35.6 /100 | #182 | Fair 97.0% |
| Immigrants | Venezuela | 34.5 /100 | #183 | Fair 97.0% |
| Spanish Americans | 33.5 /100 | #184 | Fair 97.0% |