Armenian vs Guatemalan High School Diploma
COMPARE
Armenian
Guatemalan
High School Diploma
High School Diploma Comparison
Armenians
Guatemalans
88.6%
HIGH SCHOOL DIPLOMA
17.2/ 100
METRIC RATING
204th/ 347
METRIC RANK
82.0%
HIGH SCHOOL DIPLOMA
0.0/ 100
METRIC RATING
335th/ 347
METRIC RANK
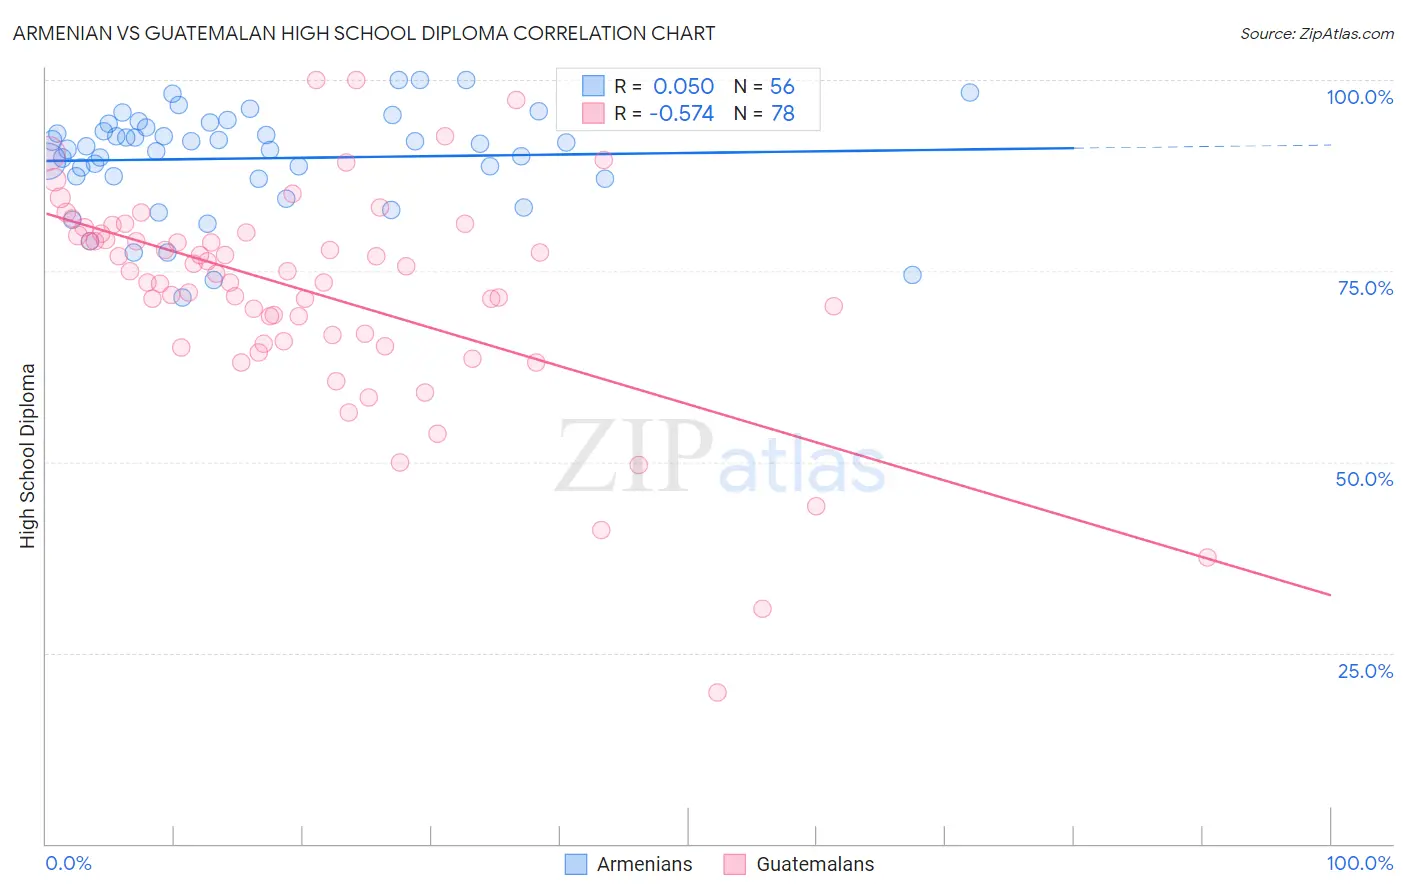
Armenian vs Guatemalan High School Diploma Correlation Chart
The statistical analysis conducted on geographies consisting of 310,954,685 people shows no correlation between the proportion of Armenians and percentage of population with at least high school diploma education in the United States with a correlation coefficient (R) of 0.050 and weighted average of 88.6%. Similarly, the statistical analysis conducted on geographies consisting of 409,566,541 people shows a substantial negative correlation between the proportion of Guatemalans and percentage of population with at least high school diploma education in the United States with a correlation coefficient (R) of -0.574 and weighted average of 82.0%, a difference of 8.1%.
High School Diploma Correlation Summary
| Measurement | Armenian | Guatemalan |
| Minimum | 71.5% | 19.8% |
| Maximum | 100.0% | 100.0% |
| Range | 28.5% | 80.2% |
| Mean | 89.7% | 72.2% |
| Median | 91.5% | 74.8% |
| Interquartile 25% (IQ1) | 87.2% | 65.9% |
| Interquartile 75% (IQ3) | 94.0% | 79.9% |
| Interquartile Range (IQR) | 6.8% | 14.1% |
| Standard Deviation (Sample) | 6.7% | 14.2% |
| Standard Deviation (Population) | 6.6% | 14.1% |
Similar Demographics by High School Diploma
Demographics Similar to Armenians by High School Diploma
In terms of high school diploma, the demographic groups most similar to Armenians are Somali (88.6%, a difference of 0.010%), Korean (88.6%, a difference of 0.020%), Panamanian (88.6%, a difference of 0.020%), Immigrants from Micronesia (88.6%, a difference of 0.020%), and Hawaiian (88.6%, a difference of 0.030%).
| Demographics | Rating | Rank | High School Diploma |
| French American Indians | 21.5 /100 | #197 | Fair 88.7% |
| Liberians | 18.8 /100 | #198 | Poor 88.7% |
| Marshallese | 18.7 /100 | #199 | Poor 88.6% |
| Hawaiians | 18.3 /100 | #200 | Poor 88.6% |
| Koreans | 18.1 /100 | #201 | Poor 88.6% |
| Panamanians | 18.0 /100 | #202 | Poor 88.6% |
| Somalis | 17.5 /100 | #203 | Poor 88.6% |
| Armenians | 17.2 /100 | #204 | Poor 88.6% |
| Immigrants | Micronesia | 16.4 /100 | #205 | Poor 88.6% |
| Arapaho | 16.1 /100 | #206 | Poor 88.6% |
| Immigrants | Sierra Leone | 15.8 /100 | #207 | Poor 88.6% |
| Portuguese | 14.4 /100 | #208 | Poor 88.5% |
| Cherokee | 14.3 /100 | #209 | Poor 88.5% |
| Samoans | 14.0 /100 | #210 | Poor 88.5% |
| Inupiat | 13.1 /100 | #211 | Poor 88.5% |
Demographics Similar to Guatemalans by High School Diploma
In terms of high school diploma, the demographic groups most similar to Guatemalans are Immigrants from Dominican Republic (82.0%, a difference of 0.010%), Tohono O'odham (82.1%, a difference of 0.11%), Immigrants from Yemen (81.8%, a difference of 0.15%), Immigrants from Latin America (82.1%, a difference of 0.22%), and Salvadoran (81.7%, a difference of 0.33%).
| Demographics | Rating | Rank | High School Diploma |
| Dominicans | 0.0 /100 | #328 | Tragic 82.9% |
| Hispanics or Latinos | 0.0 /100 | #329 | Tragic 82.9% |
| Immigrants | Azores | 0.0 /100 | #330 | Tragic 82.8% |
| Central Americans | 0.0 /100 | #331 | Tragic 82.5% |
| Immigrants | Honduras | 0.0 /100 | #332 | Tragic 82.5% |
| Immigrants | Latin America | 0.0 /100 | #333 | Tragic 82.1% |
| Tohono O'odham | 0.0 /100 | #334 | Tragic 82.1% |
| Guatemalans | 0.0 /100 | #335 | Tragic 82.0% |
| Immigrants | Dominican Republic | 0.0 /100 | #336 | Tragic 82.0% |
| Immigrants | Yemen | 0.0 /100 | #337 | Tragic 81.8% |
| Salvadorans | 0.0 /100 | #338 | Tragic 81.7% |
| Pima | 0.0 /100 | #339 | Tragic 81.6% |
| Houma | 0.0 /100 | #340 | Tragic 81.5% |
| Mexicans | 0.0 /100 | #341 | Tragic 81.4% |
| Immigrants | Guatemala | 0.0 /100 | #342 | Tragic 81.4% |