Indonesian vs Immigrants from the Azores 8th Grade
COMPARE
Indonesian
Immigrants from the Azores
8th Grade
8th Grade Comparison
Indonesians
Immigrants from the Azores
94.1%
8TH GRADE
0.0/ 100
METRIC RATING
298th/ 347
METRIC RANK
92.5%
8TH GRADE
0.0/ 100
METRIC RATING
327th/ 347
METRIC RANK
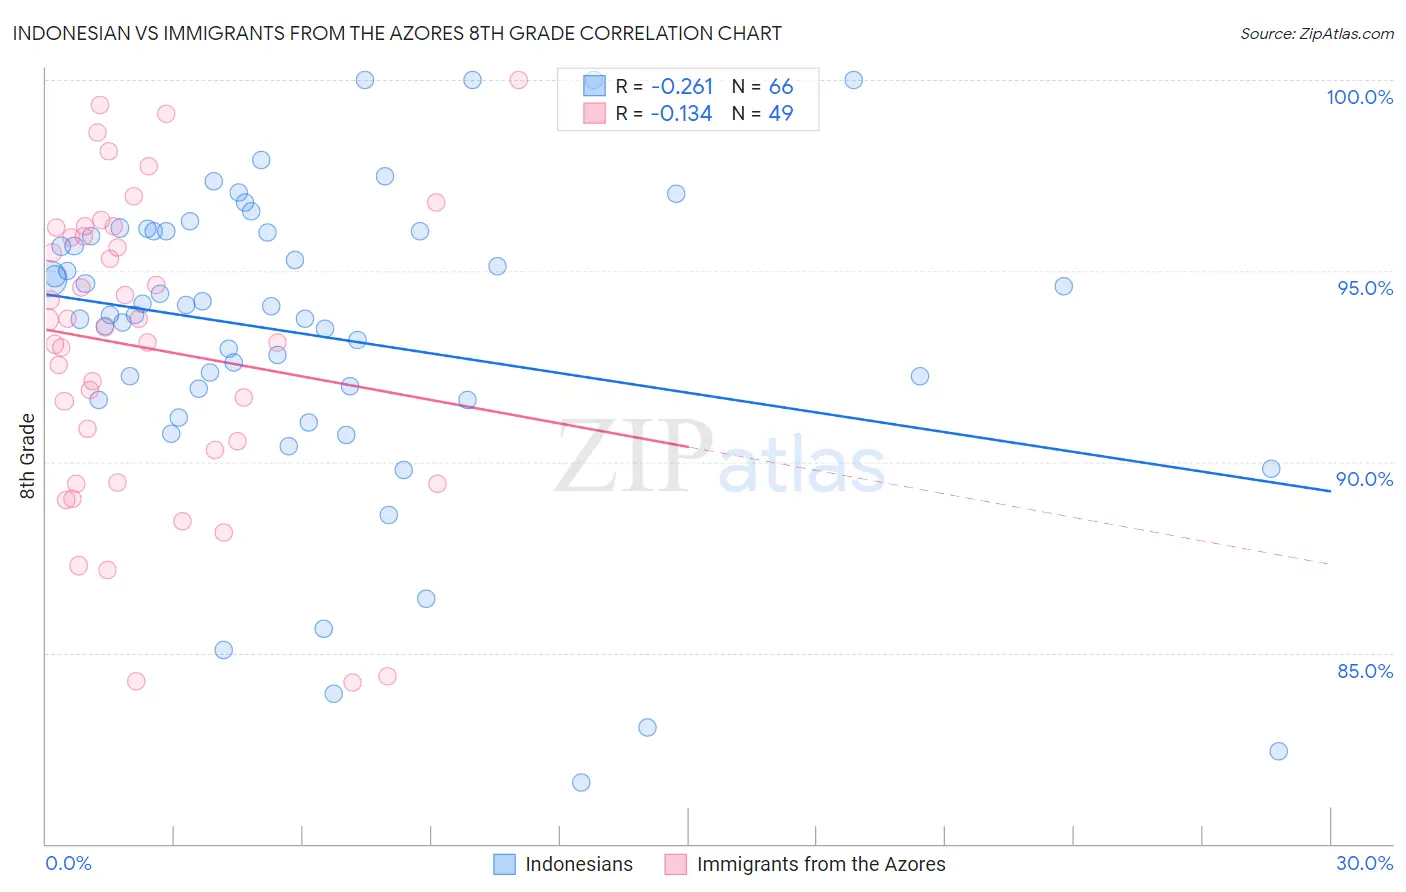
Indonesian vs Immigrants from the Azores 8th Grade Correlation Chart
The statistical analysis conducted on geographies consisting of 162,727,113 people shows a weak negative correlation between the proportion of Indonesians and percentage of population with at least 8th grade education in the United States with a correlation coefficient (R) of -0.261 and weighted average of 94.1%. Similarly, the statistical analysis conducted on geographies consisting of 46,257,310 people shows a poor negative correlation between the proportion of Immigrants from the Azores and percentage of population with at least 8th grade education in the United States with a correlation coefficient (R) of -0.134 and weighted average of 92.5%, a difference of 1.8%.
8th Grade Correlation Summary
| Measurement | Indonesian | Immigrants from the Azores |
| Minimum | 81.6% | 84.2% |
| Maximum | 100.0% | 100.0% |
| Range | 18.4% | 15.8% |
| Mean | 93.3% | 93.0% |
| Median | 94.0% | 93.5% |
| Interquartile 25% (IQ1) | 91.6% | 89.9% |
| Interquartile 75% (IQ3) | 96.0% | 96.0% |
| Interquartile Range (IQR) | 4.4% | 6.2% |
| Standard Deviation (Sample) | 4.1% | 4.0% |
| Standard Deviation (Population) | 4.1% | 3.9% |
Similar Demographics by 8th Grade
Demographics Similar to Indonesians by 8th Grade
In terms of 8th grade, the demographic groups most similar to Indonesians are Cuban (94.1%, a difference of 0.030%), Immigrants from Burma/Myanmar (94.1%, a difference of 0.030%), Immigrants from South Eastern Asia (94.2%, a difference of 0.040%), Haitian (94.2%, a difference of 0.050%), and Immigrants from Laos (94.1%, a difference of 0.050%).
| Demographics | Rating | Rank | 8th Grade |
| Immigrants | Grenada | 0.0 /100 | #291 | Tragic 94.3% |
| Bangladeshis | 0.0 /100 | #292 | Tragic 94.3% |
| Yaqui | 0.0 /100 | #293 | Tragic 94.2% |
| Houma | 0.0 /100 | #294 | Tragic 94.2% |
| Fijians | 0.0 /100 | #295 | Tragic 94.2% |
| Haitians | 0.0 /100 | #296 | Tragic 94.2% |
| Immigrants | South Eastern Asia | 0.0 /100 | #297 | Tragic 94.2% |
| Indonesians | 0.0 /100 | #298 | Tragic 94.1% |
| Cubans | 0.0 /100 | #299 | Tragic 94.1% |
| Immigrants | Burma/Myanmar | 0.0 /100 | #300 | Tragic 94.1% |
| Immigrants | Laos | 0.0 /100 | #301 | Tragic 94.1% |
| Sri Lankans | 0.0 /100 | #302 | Tragic 94.0% |
| Immigrants | Dominica | 0.0 /100 | #303 | Tragic 94.0% |
| Guyanese | 0.0 /100 | #304 | Tragic 93.9% |
| Immigrants | Haiti | 0.0 /100 | #305 | Tragic 93.9% |
Demographics Similar to Immigrants from the Azores by 8th Grade
In terms of 8th grade, the demographic groups most similar to Immigrants from the Azores are Immigrants from Nicaragua (92.5%, a difference of 0.030%), Immigrants from Cabo Verde (92.4%, a difference of 0.090%), Immigrants from Armenia (92.3%, a difference of 0.18%), Honduran (92.3%, a difference of 0.19%), and Immigrants from Dominican Republic (92.3%, a difference of 0.20%).
| Demographics | Rating | Rank | 8th Grade |
| Immigrants | Fiji | 0.0 /100 | #320 | Tragic 93.2% |
| Belizeans | 0.0 /100 | #321 | Tragic 93.1% |
| Nicaraguans | 0.0 /100 | #322 | Tragic 93.0% |
| Immigrants | Belize | 0.0 /100 | #323 | Tragic 92.9% |
| Nepalese | 0.0 /100 | #324 | Tragic 92.8% |
| Dominicans | 0.0 /100 | #325 | Tragic 92.8% |
| Central American Indians | 0.0 /100 | #326 | Tragic 92.7% |
| Immigrants | Azores | 0.0 /100 | #327 | Tragic 92.5% |
| Immigrants | Nicaragua | 0.0 /100 | #328 | Tragic 92.5% |
| Immigrants | Cabo Verde | 0.0 /100 | #329 | Tragic 92.4% |
| Immigrants | Armenia | 0.0 /100 | #330 | Tragic 92.3% |
| Hondurans | 0.0 /100 | #331 | Tragic 92.3% |
| Immigrants | Dominican Republic | 0.0 /100 | #332 | Tragic 92.3% |
| Hispanics or Latinos | 0.0 /100 | #333 | Tragic 92.2% |
| Immigrants | Yemen | 0.0 /100 | #334 | Tragic 92.1% |