Subsaharan African vs Immigrants from the Azores 8th Grade
COMPARE
Subsaharan African
Immigrants from the Azores
8th Grade
8th Grade Comparison
Sub-Saharan Africans
Immigrants from the Azores
95.3%
8TH GRADE
6.0/ 100
METRIC RATING
225th/ 347
METRIC RANK
92.5%
8TH GRADE
0.0/ 100
METRIC RATING
327th/ 347
METRIC RANK
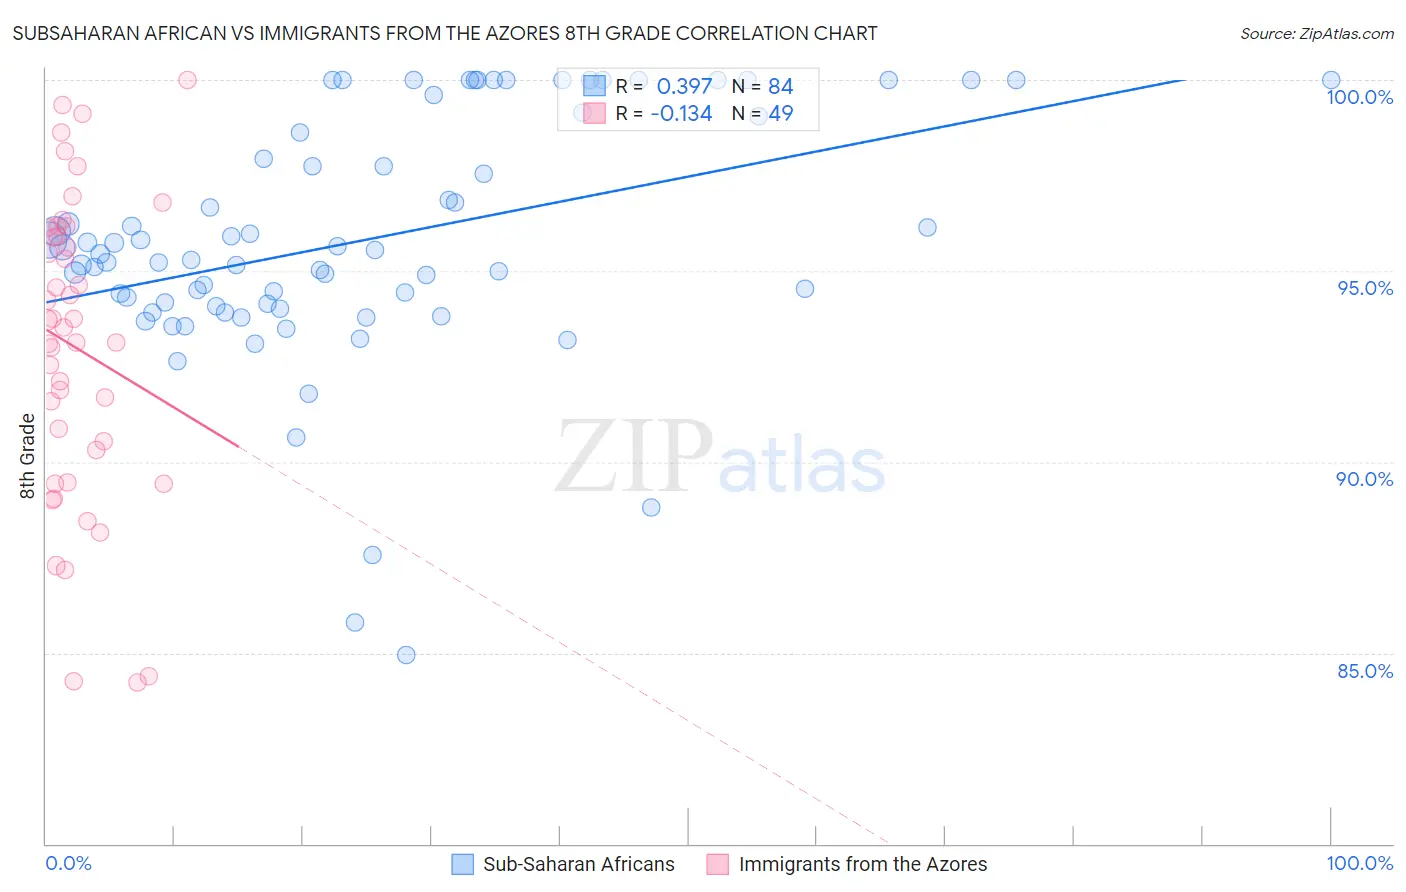
Subsaharan African vs Immigrants from the Azores 8th Grade Correlation Chart
The statistical analysis conducted on geographies consisting of 508,210,020 people shows a mild positive correlation between the proportion of Sub-Saharan Africans and percentage of population with at least 8th grade education in the United States with a correlation coefficient (R) of 0.397 and weighted average of 95.3%. Similarly, the statistical analysis conducted on geographies consisting of 46,257,310 people shows a poor negative correlation between the proportion of Immigrants from the Azores and percentage of population with at least 8th grade education in the United States with a correlation coefficient (R) of -0.134 and weighted average of 92.5%, a difference of 3.0%.
8th Grade Correlation Summary
| Measurement | Subsaharan African | Immigrants from the Azores |
| Minimum | 84.9% | 84.2% |
| Maximum | 100.0% | 100.0% |
| Range | 15.1% | 15.8% |
| Mean | 95.8% | 93.0% |
| Median | 95.5% | 93.5% |
| Interquartile 25% (IQ1) | 94.1% | 89.9% |
| Interquartile 75% (IQ3) | 98.8% | 96.0% |
| Interquartile Range (IQR) | 4.7% | 6.2% |
| Standard Deviation (Sample) | 3.2% | 4.0% |
| Standard Deviation (Population) | 3.2% | 3.9% |
Similar Demographics by 8th Grade
Demographics Similar to Sub-Saharan Africans by 8th Grade
In terms of 8th grade, the demographic groups most similar to Sub-Saharan Africans are Immigrants from Western Asia (95.3%, a difference of 0.0%), Navajo (95.3%, a difference of 0.010%), Bahamian (95.3%, a difference of 0.010%), Immigrants from Eastern Africa (95.3%, a difference of 0.010%), and Immigrants from Malaysia (95.3%, a difference of 0.030%).
| Demographics | Rating | Rank | 8th Grade |
| Dutch West Indians | 8.1 /100 | #218 | Tragic 95.4% |
| Spanish Americans | 8.0 /100 | #219 | Tragic 95.4% |
| Immigrants | Southern Europe | 7.7 /100 | #220 | Tragic 95.3% |
| Immigrants | Syria | 7.4 /100 | #221 | Tragic 95.3% |
| Immigrants | Malaysia | 7.3 /100 | #222 | Tragic 95.3% |
| Immigrants | Oceania | 7.1 /100 | #223 | Tragic 95.3% |
| Immigrants | Western Asia | 6.0 /100 | #224 | Tragic 95.3% |
| Sub-Saharan Africans | 6.0 /100 | #225 | Tragic 95.3% |
| Navajo | 5.7 /100 | #226 | Tragic 95.3% |
| Bahamians | 5.6 /100 | #227 | Tragic 95.3% |
| Immigrants | Eastern Africa | 5.6 /100 | #228 | Tragic 95.3% |
| Immigrants | Indonesia | 4.4 /100 | #229 | Tragic 95.3% |
| Immigrants | Panama | 4.1 /100 | #230 | Tragic 95.2% |
| Asians | 3.5 /100 | #231 | Tragic 95.2% |
| Indians (Asian) | 3.3 /100 | #232 | Tragic 95.2% |
Demographics Similar to Immigrants from the Azores by 8th Grade
In terms of 8th grade, the demographic groups most similar to Immigrants from the Azores are Immigrants from Nicaragua (92.5%, a difference of 0.030%), Immigrants from Cabo Verde (92.4%, a difference of 0.090%), Immigrants from Armenia (92.3%, a difference of 0.18%), Honduran (92.3%, a difference of 0.19%), and Immigrants from Dominican Republic (92.3%, a difference of 0.20%).
| Demographics | Rating | Rank | 8th Grade |
| Immigrants | Fiji | 0.0 /100 | #320 | Tragic 93.2% |
| Belizeans | 0.0 /100 | #321 | Tragic 93.1% |
| Nicaraguans | 0.0 /100 | #322 | Tragic 93.0% |
| Immigrants | Belize | 0.0 /100 | #323 | Tragic 92.9% |
| Nepalese | 0.0 /100 | #324 | Tragic 92.8% |
| Dominicans | 0.0 /100 | #325 | Tragic 92.8% |
| Central American Indians | 0.0 /100 | #326 | Tragic 92.7% |
| Immigrants | Azores | 0.0 /100 | #327 | Tragic 92.5% |
| Immigrants | Nicaragua | 0.0 /100 | #328 | Tragic 92.5% |
| Immigrants | Cabo Verde | 0.0 /100 | #329 | Tragic 92.4% |
| Immigrants | Armenia | 0.0 /100 | #330 | Tragic 92.3% |
| Hondurans | 0.0 /100 | #331 | Tragic 92.3% |
| Immigrants | Dominican Republic | 0.0 /100 | #332 | Tragic 92.3% |
| Hispanics or Latinos | 0.0 /100 | #333 | Tragic 92.2% |
| Immigrants | Yemen | 0.0 /100 | #334 | Tragic 92.1% |