Carpatho Rusyn vs Immigrants from Sri Lanka 8th Grade
COMPARE
Carpatho Rusyn
Immigrants from Sri Lanka
8th Grade
8th Grade Comparison
Carpatho Rusyns
Immigrants from Sri Lanka
98.1%
8TH GRADE
100.0/ 100
METRIC RATING
4th/ 347
METRIC RANK
95.8%
8TH GRADE
64.1/ 100
METRIC RATING
163rd/ 347
METRIC RANK
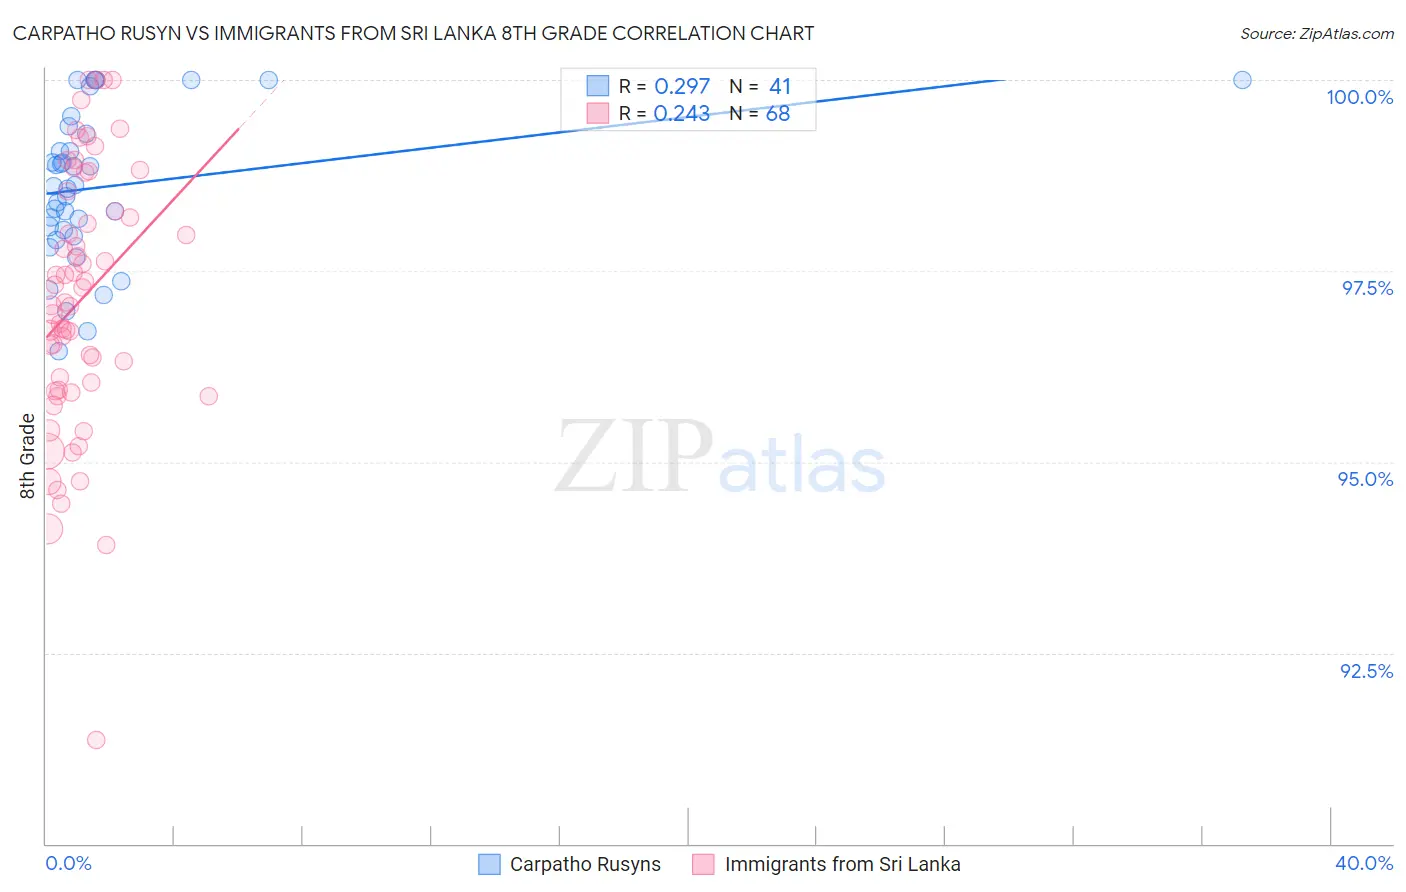
Carpatho Rusyn vs Immigrants from Sri Lanka 8th Grade Correlation Chart
The statistical analysis conducted on geographies consisting of 10,071,463 people shows a weak positive correlation between the proportion of Carpatho Rusyns and percentage of population with at least 8th grade education in the United States with a correlation coefficient (R) of 0.297 and weighted average of 98.1%. Similarly, the statistical analysis conducted on geographies consisting of 149,660,761 people shows a weak positive correlation between the proportion of Immigrants from Sri Lanka and percentage of population with at least 8th grade education in the United States with a correlation coefficient (R) of 0.243 and weighted average of 95.8%, a difference of 2.4%.
8th Grade Correlation Summary
| Measurement | Carpatho Rusyn | Immigrants from Sri Lanka |
| Minimum | 96.4% | 91.4% |
| Maximum | 100.0% | 100.0% |
| Range | 3.6% | 8.6% |
| Mean | 98.6% | 97.1% |
| Median | 98.6% | 97.1% |
| Interquartile 25% (IQ1) | 98.0% | 95.9% |
| Interquartile 75% (IQ3) | 99.3% | 98.4% |
| Interquartile Range (IQR) | 1.4% | 2.5% |
| Standard Deviation (Sample) | 0.98% | 1.7% |
| Standard Deviation (Population) | 0.97% | 1.7% |
Similar Demographics by 8th Grade
Demographics Similar to Carpatho Rusyns by 8th Grade
In terms of 8th grade, the demographic groups most similar to Carpatho Rusyns are Ottawa (97.9%, a difference of 0.20%), Finnish (98.4%, a difference of 0.23%), Dutch (97.7%, a difference of 0.49%), Norwegian (97.6%, a difference of 0.55%), and Slovak (97.6%, a difference of 0.59%).
| Demographics | Rating | Rank | 8th Grade |
| Crow | 100.0 /100 | #1 | Exceptional 99.0% |
| Tsimshian | 100.0 /100 | #2 | Exceptional 99.0% |
| Finns | 100.0 /100 | #3 | Exceptional 98.4% |
| Carpatho Rusyns | 100.0 /100 | #4 | Exceptional 98.1% |
| Ottawa | 100.0 /100 | #5 | Exceptional 97.9% |
| Dutch | 100.0 /100 | #6 | Exceptional 97.7% |
| Norwegians | 100.0 /100 | #7 | Exceptional 97.6% |
| Slovaks | 100.0 /100 | #8 | Exceptional 97.6% |
| Germans | 100.0 /100 | #9 | Exceptional 97.5% |
| Slovenes | 100.0 /100 | #10 | Exceptional 97.5% |
| Poles | 100.0 /100 | #11 | Exceptional 97.4% |
| Swedes | 100.0 /100 | #12 | Exceptional 97.4% |
| Alaskan Athabascans | 100.0 /100 | #13 | Exceptional 97.3% |
| English | 100.0 /100 | #14 | Exceptional 97.3% |
| Pennsylvania Germans | 100.0 /100 | #15 | Exceptional 97.3% |
Demographics Similar to Immigrants from Sri Lanka by 8th Grade
In terms of 8th grade, the demographic groups most similar to Immigrants from Sri Lanka are Immigrants from Italy (95.8%, a difference of 0.0%), Bermudan (95.8%, a difference of 0.020%), Immigrants from Kenya (95.8%, a difference of 0.020%), Alsatian (95.8%, a difference of 0.020%), and Immigrants from Poland (95.8%, a difference of 0.020%).
| Demographics | Rating | Rank | 8th Grade |
| Ugandans | 74.1 /100 | #156 | Good 95.9% |
| Immigrants | Taiwan | 70.5 /100 | #157 | Good 95.9% |
| Arabs | 69.4 /100 | #158 | Good 95.9% |
| Immigrants | Kazakhstan | 68.4 /100 | #159 | Good 95.9% |
| Seminole | 67.7 /100 | #160 | Good 95.8% |
| Bermudans | 67.5 /100 | #161 | Good 95.8% |
| Immigrants | Kenya | 67.2 /100 | #162 | Good 95.8% |
| Immigrants | Sri Lanka | 64.1 /100 | #163 | Good 95.8% |
| Immigrants | Italy | 63.5 /100 | #164 | Good 95.8% |
| Alsatians | 61.4 /100 | #165 | Good 95.8% |
| Immigrants | Poland | 61.1 /100 | #166 | Good 95.8% |
| Spaniards | 60.0 /100 | #167 | Good 95.8% |
| Immigrants | Ukraine | 59.5 /100 | #168 | Average 95.8% |
| Immigrants | Iran | 58.6 /100 | #169 | Average 95.8% |
| Ute | 58.5 /100 | #170 | Average 95.8% |