Carpatho Rusyn vs South American Indian 8th Grade
COMPARE
Carpatho Rusyn
South American Indian
8th Grade
8th Grade Comparison
Carpatho Rusyns
South American Indians
98.1%
8TH GRADE
100.0/ 100
METRIC RATING
4th/ 347
METRIC RANK
95.1%
8TH GRADE
1.9/ 100
METRIC RATING
241st/ 347
METRIC RANK
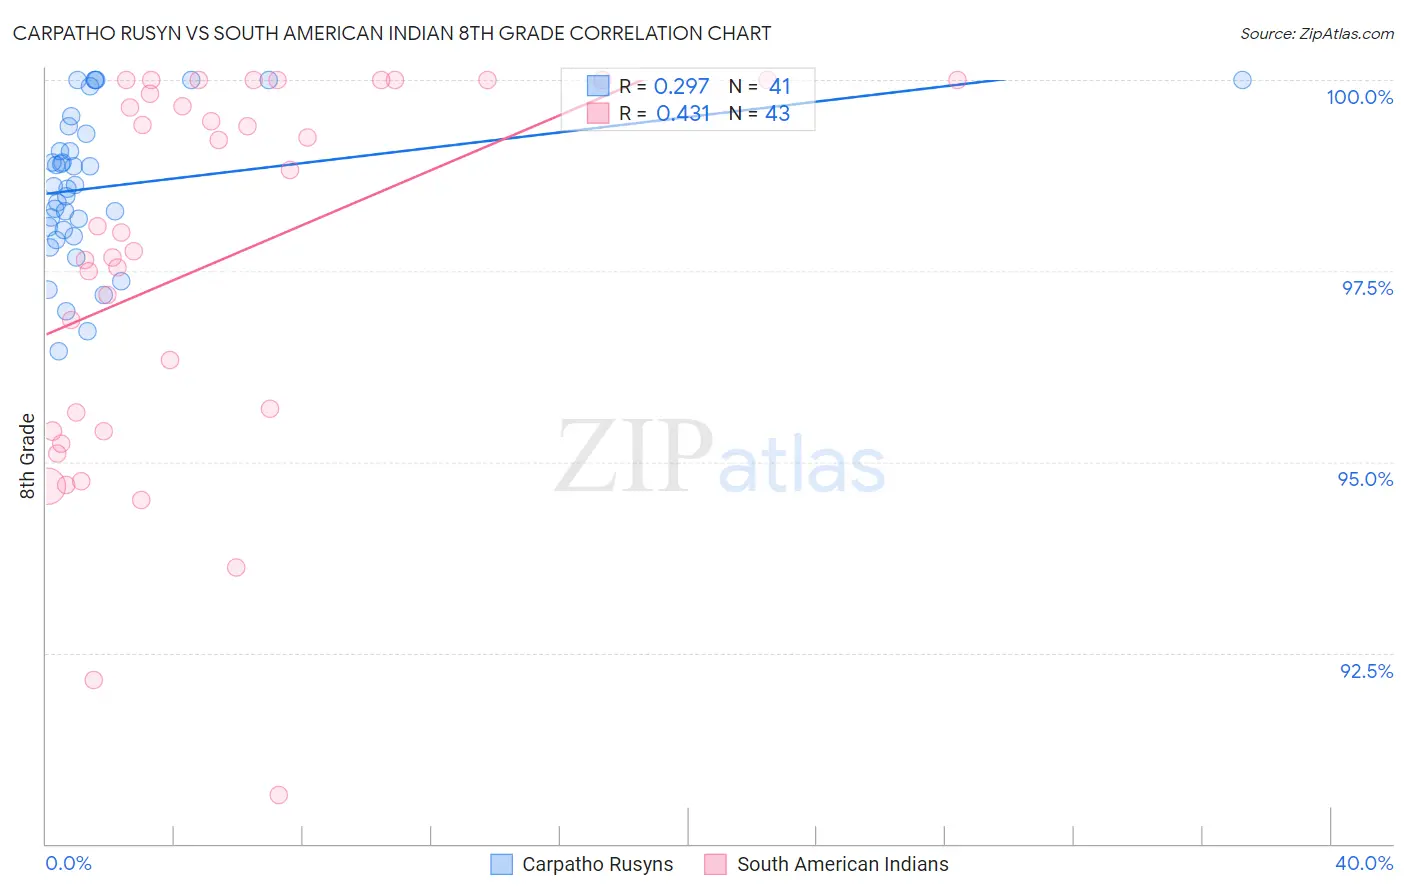
Carpatho Rusyn vs South American Indian 8th Grade Correlation Chart
The statistical analysis conducted on geographies consisting of 10,071,463 people shows a weak positive correlation between the proportion of Carpatho Rusyns and percentage of population with at least 8th grade education in the United States with a correlation coefficient (R) of 0.297 and weighted average of 98.1%. Similarly, the statistical analysis conducted on geographies consisting of 164,573,401 people shows a moderate positive correlation between the proportion of South American Indians and percentage of population with at least 8th grade education in the United States with a correlation coefficient (R) of 0.431 and weighted average of 95.1%, a difference of 3.2%.
8th Grade Correlation Summary
| Measurement | Carpatho Rusyn | South American Indian |
| Minimum | 96.4% | 90.6% |
| Maximum | 100.0% | 100.0% |
| Range | 3.6% | 9.4% |
| Mean | 98.6% | 97.6% |
| Median | 98.6% | 98.0% |
| Interquartile 25% (IQ1) | 98.0% | 95.4% |
| Interquartile 75% (IQ3) | 99.3% | 100.0% |
| Interquartile Range (IQR) | 1.4% | 4.6% |
| Standard Deviation (Sample) | 0.98% | 2.5% |
| Standard Deviation (Population) | 0.97% | 2.4% |
Similar Demographics by 8th Grade
Demographics Similar to Carpatho Rusyns by 8th Grade
In terms of 8th grade, the demographic groups most similar to Carpatho Rusyns are Ottawa (97.9%, a difference of 0.20%), Finnish (98.4%, a difference of 0.23%), Dutch (97.7%, a difference of 0.49%), Norwegian (97.6%, a difference of 0.55%), and Slovak (97.6%, a difference of 0.59%).
| Demographics | Rating | Rank | 8th Grade |
| Crow | 100.0 /100 | #1 | Exceptional 99.0% |
| Tsimshian | 100.0 /100 | #2 | Exceptional 99.0% |
| Finns | 100.0 /100 | #3 | Exceptional 98.4% |
| Carpatho Rusyns | 100.0 /100 | #4 | Exceptional 98.1% |
| Ottawa | 100.0 /100 | #5 | Exceptional 97.9% |
| Dutch | 100.0 /100 | #6 | Exceptional 97.7% |
| Norwegians | 100.0 /100 | #7 | Exceptional 97.6% |
| Slovaks | 100.0 /100 | #8 | Exceptional 97.6% |
| Germans | 100.0 /100 | #9 | Exceptional 97.5% |
| Slovenes | 100.0 /100 | #10 | Exceptional 97.5% |
| Poles | 100.0 /100 | #11 | Exceptional 97.4% |
| Swedes | 100.0 /100 | #12 | Exceptional 97.4% |
| Alaskan Athabascans | 100.0 /100 | #13 | Exceptional 97.3% |
| English | 100.0 /100 | #14 | Exceptional 97.3% |
| Pennsylvania Germans | 100.0 /100 | #15 | Exceptional 97.3% |
Demographics Similar to South American Indians by 8th Grade
In terms of 8th grade, the demographic groups most similar to South American Indians are Immigrants from Sierra Leone (95.1%, a difference of 0.010%), Ethiopian (95.1%, a difference of 0.010%), Tongan (95.1%, a difference of 0.020%), Paiute (95.1%, a difference of 0.020%), and Immigrants from Middle Africa (95.1%, a difference of 0.020%).
| Demographics | Rating | Rank | 8th Grade |
| Costa Ricans | 3.0 /100 | #234 | Tragic 95.2% |
| Nigerians | 2.9 /100 | #235 | Tragic 95.2% |
| Senegalese | 2.7 /100 | #236 | Tragic 95.2% |
| Immigrants | Africa | 2.7 /100 | #237 | Tragic 95.2% |
| Natives/Alaskans | 2.3 /100 | #238 | Tragic 95.2% |
| Immigrants | Sierra Leone | 2.1 /100 | #239 | Tragic 95.1% |
| Ethiopians | 2.0 /100 | #240 | Tragic 95.1% |
| South American Indians | 1.9 /100 | #241 | Tragic 95.1% |
| Tongans | 1.7 /100 | #242 | Tragic 95.1% |
| Paiute | 1.7 /100 | #243 | Tragic 95.1% |
| Immigrants | Middle Africa | 1.7 /100 | #244 | Tragic 95.1% |
| Jamaicans | 1.4 /100 | #245 | Tragic 95.1% |
| Somalis | 1.4 /100 | #246 | Tragic 95.1% |
| Immigrants | Senegal | 1.4 /100 | #247 | Tragic 95.1% |
| Uruguayans | 1.2 /100 | #248 | Tragic 95.1% |