Cape Verdean vs Ute Female Poverty Among 18-24 Year Olds
COMPARE
Cape Verdean
Ute
Female Poverty Among 18-24 Year Olds
Female Poverty Among 18-24 Year Olds Comparison
Cape Verdeans
Ute
19.4%
FEMALE POVERTY AMONG 18-24 YEAR OLDS
93.6/ 100
METRIC RATING
127th/ 347
METRIC RANK
25.4%
FEMALE POVERTY AMONG 18-24 YEAR OLDS
0.0/ 100
METRIC RATING
327th/ 347
METRIC RANK
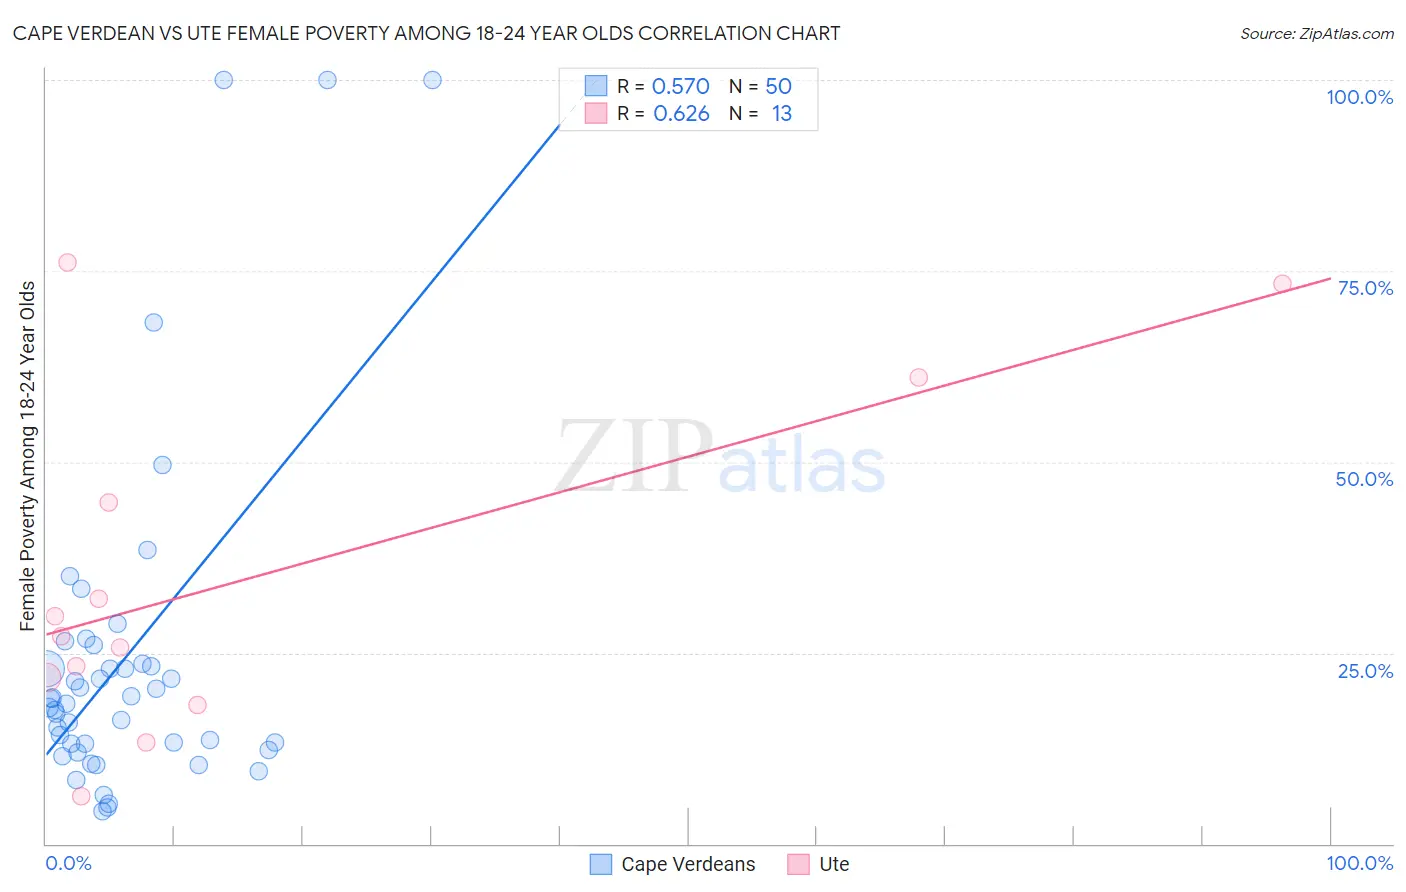
Cape Verdean vs Ute Female Poverty Among 18-24 Year Olds Correlation Chart
The statistical analysis conducted on geographies consisting of 106,282,002 people shows a substantial positive correlation between the proportion of Cape Verdeans and poverty level among females between the ages 18 and 24 in the United States with a correlation coefficient (R) of 0.570 and weighted average of 19.4%. Similarly, the statistical analysis conducted on geographies consisting of 55,446,169 people shows a significant positive correlation between the proportion of Ute and poverty level among females between the ages 18 and 24 in the United States with a correlation coefficient (R) of 0.626 and weighted average of 25.4%, a difference of 30.7%.
Female Poverty Among 18-24 Year Olds Correlation Summary
| Measurement | Cape Verdean | Ute |
| Minimum | 4.2% | 6.2% |
| Maximum | 100.0% | 76.1% |
| Range | 95.8% | 69.9% |
| Mean | 24.3% | 34.8% |
| Median | 18.6% | 27.1% |
| Interquartile 25% (IQ1) | 13.1% | 19.9% |
| Interquartile 75% (IQ3) | 23.6% | 52.9% |
| Interquartile Range (IQR) | 10.5% | 33.0% |
| Standard Deviation (Sample) | 22.3% | 22.4% |
| Standard Deviation (Population) | 22.1% | 21.5% |
Similar Demographics by Female Poverty Among 18-24 Year Olds
Demographics Similar to Cape Verdeans by Female Poverty Among 18-24 Year Olds
In terms of female poverty among 18-24 year olds, the demographic groups most similar to Cape Verdeans are Immigrants from Russia (19.4%, a difference of 0.020%), Immigrants from Panama (19.4%, a difference of 0.080%), Slovak (19.5%, a difference of 0.13%), Immigrants from England (19.5%, a difference of 0.14%), and Immigrants from Canada (19.5%, a difference of 0.14%).
| Demographics | Rating | Rank | Female Poverty Among 18-24 Year Olds |
| Immigrants | Northern Europe | 95.4 /100 | #120 | Exceptional 19.4% |
| Guyanese | 95.3 /100 | #121 | Exceptional 19.4% |
| Cambodians | 94.6 /100 | #122 | Exceptional 19.4% |
| Paraguayans | 94.6 /100 | #123 | Exceptional 19.4% |
| Immigrants | Chile | 94.3 /100 | #124 | Exceptional 19.4% |
| Immigrants | Panama | 94.0 /100 | #125 | Exceptional 19.4% |
| Immigrants | Russia | 93.7 /100 | #126 | Exceptional 19.4% |
| Cape Verdeans | 93.6 /100 | #127 | Exceptional 19.4% |
| Slovaks | 92.9 /100 | #128 | Exceptional 19.5% |
| Immigrants | England | 92.9 /100 | #129 | Exceptional 19.5% |
| Immigrants | Canada | 92.9 /100 | #130 | Exceptional 19.5% |
| Latvians | 92.7 /100 | #131 | Exceptional 19.5% |
| Jamaicans | 92.1 /100 | #132 | Exceptional 19.5% |
| Turks | 92.1 /100 | #133 | Exceptional 19.5% |
| Immigrants | North America | 92.1 /100 | #134 | Exceptional 19.5% |
Demographics Similar to Ute by Female Poverty Among 18-24 Year Olds
In terms of female poverty among 18-24 year olds, the demographic groups most similar to Ute are Native/Alaskan (25.4%, a difference of 0.050%), Yakama (25.3%, a difference of 0.23%), Immigrants from Saudi Arabia (25.3%, a difference of 0.48%), German Russian (25.2%, a difference of 0.91%), and Arapaho (25.2%, a difference of 0.94%).
| Demographics | Rating | Rank | Female Poverty Among 18-24 Year Olds |
| Immigrants | Congo | 0.0 /100 | #320 | Tragic 24.6% |
| Immigrants | Zaire | 0.0 /100 | #321 | Tragic 25.1% |
| Somalis | 0.0 /100 | #322 | Tragic 25.1% |
| Arapaho | 0.0 /100 | #323 | Tragic 25.2% |
| German Russians | 0.0 /100 | #324 | Tragic 25.2% |
| Immigrants | Saudi Arabia | 0.0 /100 | #325 | Tragic 25.3% |
| Yakama | 0.0 /100 | #326 | Tragic 25.3% |
| Ute | 0.0 /100 | #327 | Tragic 25.4% |
| Natives/Alaskans | 0.0 /100 | #328 | Tragic 25.4% |
| Cajuns | 0.0 /100 | #329 | Tragic 25.7% |
| Immigrants | Somalia | 0.0 /100 | #330 | Tragic 25.7% |
| Chippewa | 0.0 /100 | #331 | Tragic 25.9% |
| Houma | 0.0 /100 | #332 | Tragic 26.2% |
| Apache | 0.0 /100 | #333 | Tragic 26.3% |
| Pueblo | 0.0 /100 | #334 | Tragic 26.9% |