Immigrants from Sudan vs Immigrants from Russia College, Under 1 year
COMPARE
Immigrants from Sudan
Immigrants from Russia
College, Under 1 year
College, Under 1 year Comparison
Immigrants from Sudan
Immigrants from Russia
66.2%
COLLEGE, UNDER 1 YEAR
76.0/ 100
METRIC RATING
151st/ 347
METRIC RANK
69.9%
COLLEGE, UNDER 1 YEAR
99.8/ 100
METRIC RATING
52nd/ 347
METRIC RANK
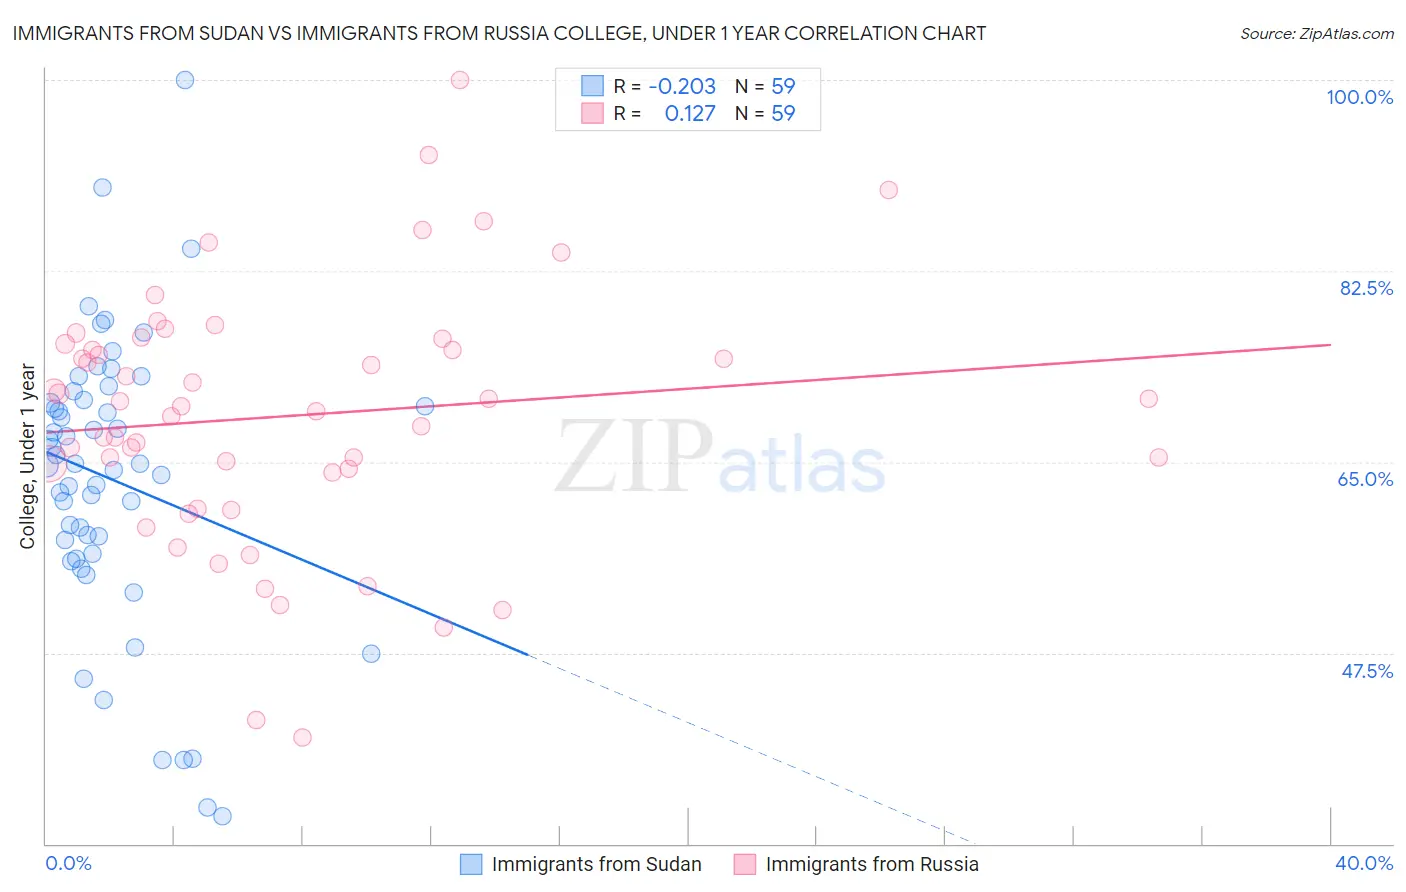
Immigrants from Sudan vs Immigrants from Russia College, Under 1 year Correlation Chart
The statistical analysis conducted on geographies consisting of 118,973,526 people shows a weak negative correlation between the proportion of Immigrants from Sudan and percentage of population with at least college, under 1 year education in the United States with a correlation coefficient (R) of -0.203 and weighted average of 66.2%. Similarly, the statistical analysis conducted on geographies consisting of 347,947,137 people shows a poor positive correlation between the proportion of Immigrants from Russia and percentage of population with at least college, under 1 year education in the United States with a correlation coefficient (R) of 0.127 and weighted average of 69.9%, a difference of 5.4%.
College, Under 1 year Correlation Summary
| Measurement | Immigrants from Sudan | Immigrants from Russia |
| Minimum | 32.5% | 39.8% |
| Maximum | 100.0% | 100.0% |
| Range | 67.5% | 60.2% |
| Mean | 63.4% | 69.2% |
| Median | 64.8% | 70.1% |
| Interquartile 25% (IQ1) | 56.6% | 64.1% |
| Interquartile 75% (IQ3) | 70.7% | 75.8% |
| Interquartile Range (IQR) | 14.1% | 11.8% |
| Standard Deviation (Sample) | 13.2% | 11.7% |
| Standard Deviation (Population) | 13.0% | 11.6% |
Similar Demographics by College, Under 1 year
Demographics Similar to Immigrants from Sudan by College, Under 1 year
In terms of college, under 1 year, the demographic groups most similar to Immigrants from Sudan are Immigrants from Iraq (66.3%, a difference of 0.070%), Sudanese (66.2%, a difference of 0.11%), Immigrants from Venezuela (66.3%, a difference of 0.12%), Belgian (66.2%, a difference of 0.13%), and Taiwanese (66.4%, a difference of 0.16%).
| Demographics | Rating | Rank | College, Under 1 year |
| Immigrants | Germany | 82.0 /100 | #144 | Excellent 66.5% |
| Immigrants | Kenya | 81.8 /100 | #145 | Excellent 66.5% |
| Kenyans | 81.7 /100 | #146 | Excellent 66.5% |
| Immigrants | Morocco | 81.7 /100 | #147 | Excellent 66.5% |
| Taiwanese | 78.6 /100 | #148 | Good 66.4% |
| Immigrants | Venezuela | 77.9 /100 | #149 | Good 66.3% |
| Immigrants | Iraq | 77.1 /100 | #150 | Good 66.3% |
| Immigrants | Sudan | 76.0 /100 | #151 | Good 66.2% |
| Sudanese | 74.1 /100 | #152 | Good 66.2% |
| Belgians | 73.7 /100 | #153 | Good 66.2% |
| Immigrants | Eritrea | 71.9 /100 | #154 | Good 66.1% |
| Irish | 70.3 /100 | #155 | Good 66.0% |
| Welsh | 69.9 /100 | #156 | Good 66.0% |
| Sierra Leoneans | 67.8 /100 | #157 | Good 66.0% |
| Celtics | 67.3 /100 | #158 | Good 65.9% |
Demographics Similar to Immigrants from Russia by College, Under 1 year
In terms of college, under 1 year, the demographic groups most similar to Immigrants from Russia are Mongolian (69.9%, a difference of 0.020%), Zimbabwean (69.9%, a difference of 0.060%), Immigrants from Austria (70.0%, a difference of 0.18%), Immigrants from Netherlands (70.0%, a difference of 0.22%), and South African (69.7%, a difference of 0.27%).
| Demographics | Rating | Rank | College, Under 1 year |
| Immigrants | Norway | 99.9 /100 | #45 | Exceptional 70.2% |
| Immigrants | Latvia | 99.9 /100 | #46 | Exceptional 70.1% |
| Immigrants | Bulgaria | 99.8 /100 | #47 | Exceptional 70.0% |
| Immigrants | Netherlands | 99.8 /100 | #48 | Exceptional 70.0% |
| Immigrants | Austria | 99.8 /100 | #49 | Exceptional 70.0% |
| Zimbabweans | 99.8 /100 | #50 | Exceptional 69.9% |
| Mongolians | 99.8 /100 | #51 | Exceptional 69.9% |
| Immigrants | Russia | 99.8 /100 | #52 | Exceptional 69.9% |
| South Africans | 99.7 /100 | #53 | Exceptional 69.7% |
| Immigrants | Czechoslovakia | 99.7 /100 | #54 | Exceptional 69.6% |
| Maltese | 99.7 /100 | #55 | Exceptional 69.5% |
| Immigrants | Scotland | 99.6 /100 | #56 | Exceptional 69.4% |
| Asians | 99.6 /100 | #57 | Exceptional 69.4% |
| Immigrants | Malaysia | 99.6 /100 | #58 | Exceptional 69.3% |
| Immigrants | Serbia | 99.5 /100 | #59 | Exceptional 69.3% |