Canadian vs Sudanese 10th Grade
COMPARE
Canadian
Sudanese
10th Grade
10th Grade Comparison
Canadians
Sudanese
94.9%
10TH GRADE
99.6/ 100
METRIC RATING
74th/ 347
METRIC RANK
93.6%
10TH GRADE
36.6/ 100
METRIC RATING
185th/ 347
METRIC RANK
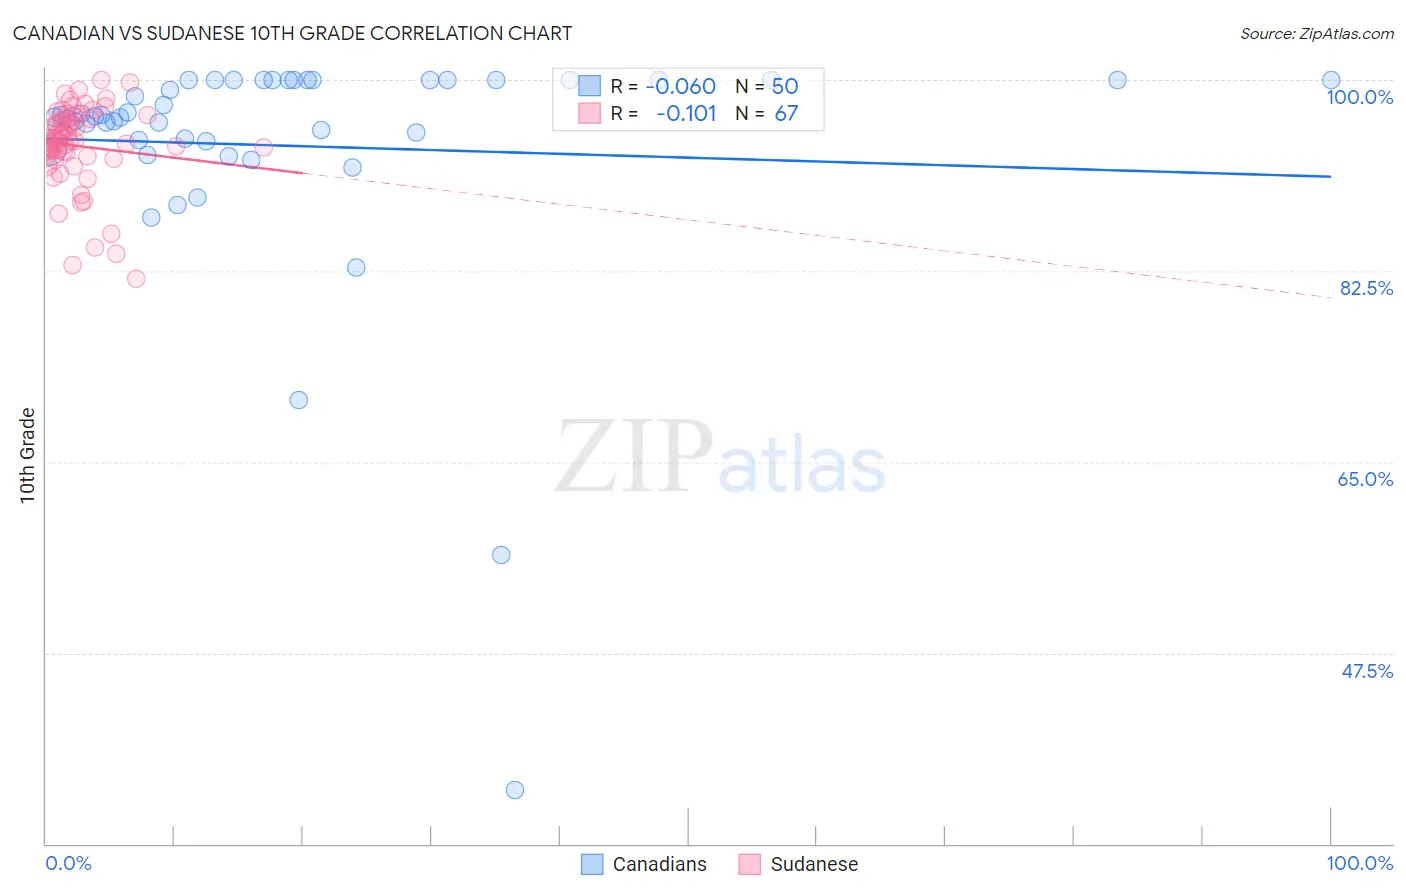
Canadian vs Sudanese 10th Grade Correlation Chart
The statistical analysis conducted on geographies consisting of 437,556,598 people shows a slight negative correlation between the proportion of Canadians and percentage of population with at least 10th grade education in the United States with a correlation coefficient (R) of -0.060 and weighted average of 94.9%. Similarly, the statistical analysis conducted on geographies consisting of 110,134,719 people shows a poor negative correlation between the proportion of Sudanese and percentage of population with at least 10th grade education in the United States with a correlation coefficient (R) of -0.101 and weighted average of 93.6%, a difference of 1.3%.
10th Grade Correlation Summary
| Measurement | Canadian | Sudanese |
| Minimum | 34.9% | 81.8% |
| Maximum | 100.0% | 100.0% |
| Range | 65.1% | 18.2% |
| Mean | 94.0% | 93.9% |
| Median | 96.6% | 94.4% |
| Interquartile 25% (IQ1) | 94.4% | 93.0% |
| Interquartile 75% (IQ3) | 100.0% | 96.5% |
| Interquartile Range (IQR) | 5.6% | 3.5% |
| Standard Deviation (Sample) | 11.5% | 3.8% |
| Standard Deviation (Population) | 11.3% | 3.8% |
Similar Demographics by 10th Grade
Demographics Similar to Canadians by 10th Grade
In terms of 10th grade, the demographic groups most similar to Canadians are Bhutanese (94.9%, a difference of 0.0%), Immigrants from Sweden (94.9%, a difference of 0.010%), Alaska Native (94.9%, a difference of 0.020%), Zimbabwean (94.9%, a difference of 0.030%), and Okinawan (94.8%, a difference of 0.030%).
| Demographics | Rating | Rank | 10th Grade |
| Immigrants | Netherlands | 99.7 /100 | #67 | Exceptional 94.9% |
| Immigrants | Belgium | 99.7 /100 | #68 | Exceptional 94.9% |
| Immigrants | England | 99.6 /100 | #69 | Exceptional 94.9% |
| Zimbabweans | 99.6 /100 | #70 | Exceptional 94.9% |
| Alaska Natives | 99.6 /100 | #71 | Exceptional 94.9% |
| Immigrants | Sweden | 99.6 /100 | #72 | Exceptional 94.9% |
| Bhutanese | 99.6 /100 | #73 | Exceptional 94.9% |
| Canadians | 99.6 /100 | #74 | Exceptional 94.9% |
| Okinawans | 99.5 /100 | #75 | Exceptional 94.8% |
| Romanians | 99.5 /100 | #76 | Exceptional 94.8% |
| Immigrants | South Africa | 99.5 /100 | #77 | Exceptional 94.8% |
| Filipinos | 99.3 /100 | #78 | Exceptional 94.8% |
| Immigrants | Czechoslovakia | 99.2 /100 | #79 | Exceptional 94.7% |
| Immigrants | Denmark | 99.2 /100 | #80 | Exceptional 94.7% |
| Immigrants | Latvia | 99.2 /100 | #81 | Exceptional 94.7% |
Demographics Similar to Sudanese by 10th Grade
In terms of 10th grade, the demographic groups most similar to Sudanese are Guamanian/Chamorro (93.6%, a difference of 0.0%), Choctaw (93.6%, a difference of 0.0%), Immigrants from Eastern Asia (93.6%, a difference of 0.010%), Colville (93.6%, a difference of 0.020%), and Liberian (93.6%, a difference of 0.020%).
| Demographics | Rating | Rank | 10th Grade |
| Sierra Leoneans | 46.1 /100 | #178 | Average 93.7% |
| Paraguayans | 45.3 /100 | #179 | Average 93.7% |
| Blackfeet | 42.8 /100 | #180 | Average 93.7% |
| Immigrants | Northern Africa | 41.6 /100 | #181 | Average 93.7% |
| Colville | 38.8 /100 | #182 | Fair 93.6% |
| Guamanians/Chamorros | 37.1 /100 | #183 | Fair 93.6% |
| Choctaw | 36.6 /100 | #184 | Fair 93.6% |
| Sudanese | 36.6 /100 | #185 | Fair 93.6% |
| Immigrants | Eastern Asia | 35.1 /100 | #186 | Fair 93.6% |
| Liberians | 34.7 /100 | #187 | Fair 93.6% |
| Marshallese | 33.2 /100 | #188 | Fair 93.6% |
| Immigrants | Pakistan | 32.5 /100 | #189 | Fair 93.6% |
| Laotians | 32.1 /100 | #190 | Fair 93.6% |
| Yup'ik | 31.1 /100 | #191 | Fair 93.6% |
| Immigrants | Malaysia | 28.0 /100 | #192 | Fair 93.5% |