Canadian vs Immigrants from Western Europe 10th Grade
COMPARE
Canadian
Immigrants from Western Europe
10th Grade
10th Grade Comparison
Canadians
Immigrants from Western Europe
94.9%
10TH GRADE
99.6/ 100
METRIC RATING
74th/ 347
METRIC RANK
94.7%
10TH GRADE
99.1/ 100
METRIC RATING
83rd/ 347
METRIC RANK
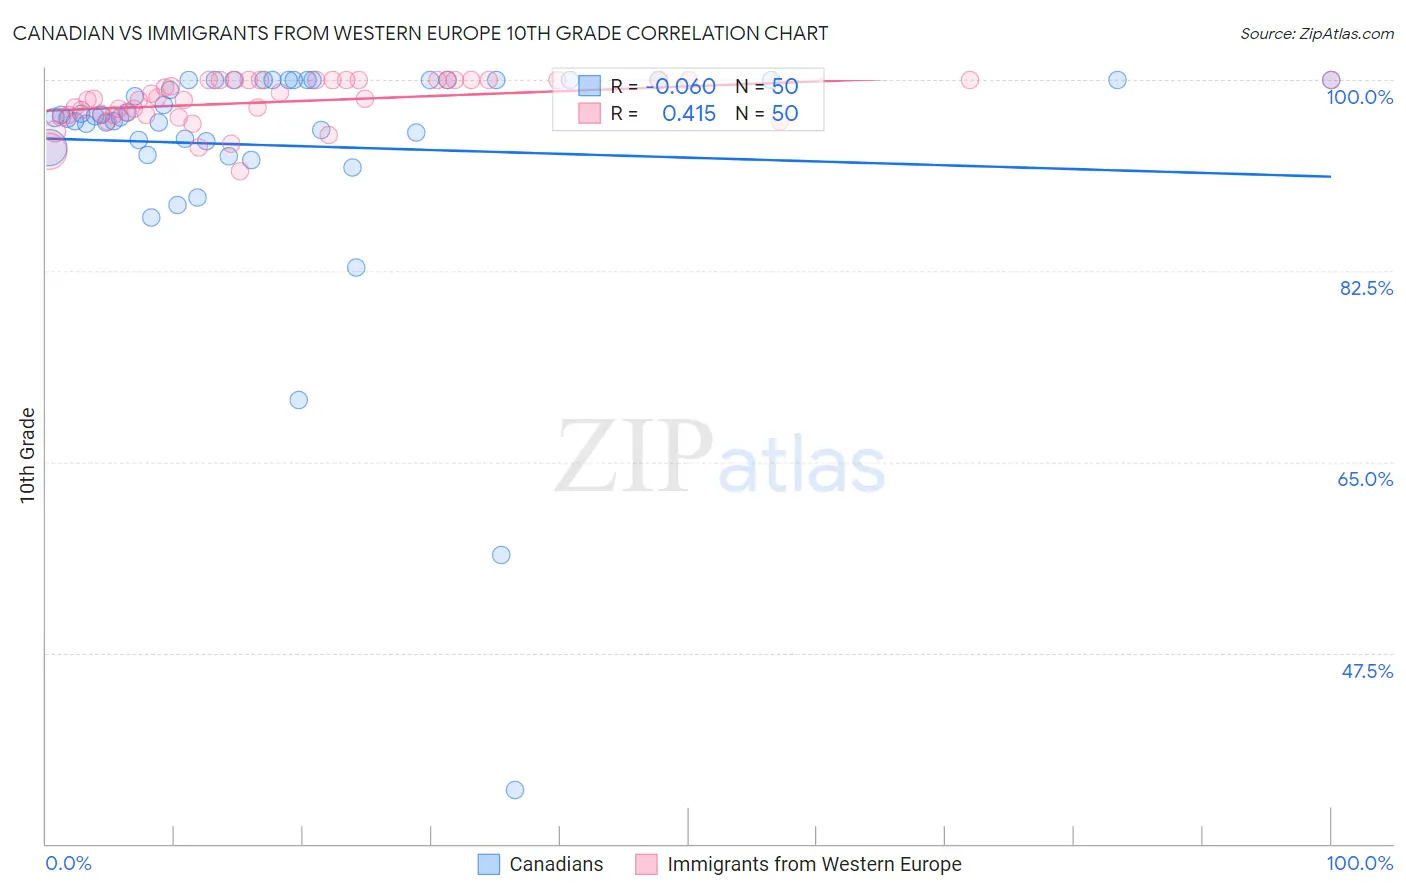
Canadian vs Immigrants from Western Europe 10th Grade Correlation Chart
The statistical analysis conducted on geographies consisting of 437,556,598 people shows a slight negative correlation between the proportion of Canadians and percentage of population with at least 10th grade education in the United States with a correlation coefficient (R) of -0.060 and weighted average of 94.9%. Similarly, the statistical analysis conducted on geographies consisting of 494,080,496 people shows a moderate positive correlation between the proportion of Immigrants from Western Europe and percentage of population with at least 10th grade education in the United States with a correlation coefficient (R) of 0.415 and weighted average of 94.7%, a difference of 0.17%.
10th Grade Correlation Summary
| Measurement | Canadian | Immigrants from Western Europe |
| Minimum | 34.9% | 91.6% |
| Maximum | 100.0% | 100.0% |
| Range | 65.1% | 8.4% |
| Mean | 94.0% | 98.0% |
| Median | 96.6% | 98.3% |
| Interquartile 25% (IQ1) | 94.4% | 96.8% |
| Interquartile 75% (IQ3) | 100.0% | 100.0% |
| Interquartile Range (IQR) | 5.6% | 3.2% |
| Standard Deviation (Sample) | 11.5% | 2.1% |
| Standard Deviation (Population) | 11.3% | 2.1% |
Demographics Similar to Canadians and Immigrants from Western Europe by 10th Grade
In terms of 10th grade, the demographic groups most similar to Canadians are Bhutanese (94.9%, a difference of 0.0%), Immigrants from Sweden (94.9%, a difference of 0.010%), Alaska Native (94.9%, a difference of 0.020%), Zimbabwean (94.9%, a difference of 0.030%), and Okinawan (94.8%, a difference of 0.030%). Similarly, the demographic groups most similar to Immigrants from Western Europe are Icelander (94.7%, a difference of 0.0%), Swiss (94.7%, a difference of 0.010%), Crow (94.7%, a difference of 0.010%), Puget Sound Salish (94.7%, a difference of 0.010%), and Immigrants from Saudi Arabia (94.7%, a difference of 0.020%).
| Demographics | Rating | Rank | 10th Grade |
| Immigrants | Belgium | 99.7 /100 | #68 | Exceptional 94.9% |
| Immigrants | England | 99.6 /100 | #69 | Exceptional 94.9% |
| Zimbabweans | 99.6 /100 | #70 | Exceptional 94.9% |
| Alaska Natives | 99.6 /100 | #71 | Exceptional 94.9% |
| Immigrants | Sweden | 99.6 /100 | #72 | Exceptional 94.9% |
| Bhutanese | 99.6 /100 | #73 | Exceptional 94.9% |
| Canadians | 99.6 /100 | #74 | Exceptional 94.9% |
| Okinawans | 99.5 /100 | #75 | Exceptional 94.8% |
| Romanians | 99.5 /100 | #76 | Exceptional 94.8% |
| Immigrants | South Africa | 99.5 /100 | #77 | Exceptional 94.8% |
| Filipinos | 99.3 /100 | #78 | Exceptional 94.8% |
| Immigrants | Czechoslovakia | 99.2 /100 | #79 | Exceptional 94.7% |
| Immigrants | Denmark | 99.2 /100 | #80 | Exceptional 94.7% |
| Immigrants | Latvia | 99.2 /100 | #81 | Exceptional 94.7% |
| Swiss | 99.1 /100 | #82 | Exceptional 94.7% |
| Immigrants | Western Europe | 99.1 /100 | #83 | Exceptional 94.7% |
| Icelanders | 99.1 /100 | #84 | Exceptional 94.7% |
| Crow | 99.0 /100 | #85 | Exceptional 94.7% |
| Puget Sound Salish | 99.0 /100 | #86 | Exceptional 94.7% |
| Immigrants | Saudi Arabia | 99.0 /100 | #87 | Exceptional 94.7% |
| Immigrants | Japan | 99.0 /100 | #88 | Exceptional 94.7% |