Canadian vs Sudanese 6th Grade
COMPARE
Canadian
Sudanese
6th Grade
6th Grade Comparison
Canadians
Sudanese
97.7%
6TH GRADE
99.7/ 100
METRIC RATING
64th/ 347
METRIC RANK
96.8%
6TH GRADE
13.9/ 100
METRIC RATING
203rd/ 347
METRIC RANK
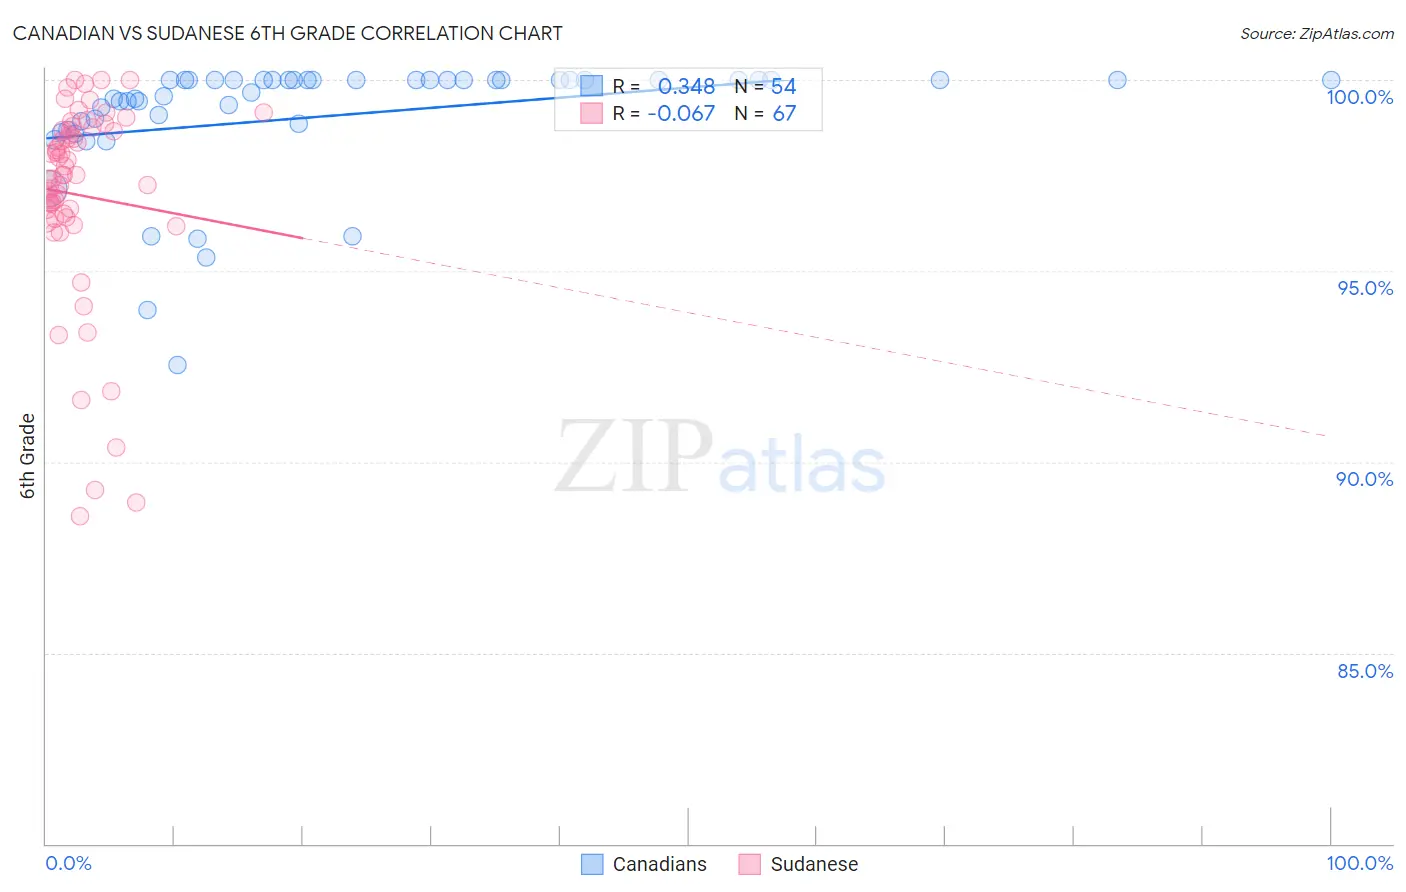
Canadian vs Sudanese 6th Grade Correlation Chart
The statistical analysis conducted on geographies consisting of 437,556,929 people shows a mild positive correlation between the proportion of Canadians and percentage of population with at least 6th grade education in the United States with a correlation coefficient (R) of 0.348 and weighted average of 97.7%. Similarly, the statistical analysis conducted on geographies consisting of 110,114,612 people shows a slight negative correlation between the proportion of Sudanese and percentage of population with at least 6th grade education in the United States with a correlation coefficient (R) of -0.067 and weighted average of 96.8%, a difference of 0.86%.
6th Grade Correlation Summary
| Measurement | Canadian | Sudanese |
| Minimum | 92.6% | 88.6% |
| Maximum | 100.0% | 100.0% |
| Range | 7.4% | 11.4% |
| Mean | 99.1% | 97.0% |
| Median | 100.0% | 97.5% |
| Interquartile 25% (IQ1) | 98.9% | 96.4% |
| Interquartile 75% (IQ3) | 100.0% | 98.7% |
| Interquartile Range (IQR) | 1.1% | 2.3% |
| Standard Deviation (Sample) | 1.6% | 2.6% |
| Standard Deviation (Population) | 1.6% | 2.6% |
Similar Demographics by 6th Grade
Demographics Similar to Canadians by 6th Grade
In terms of 6th grade, the demographic groups most similar to Canadians are Russian (97.7%, a difference of 0.010%), Immigrants from Northern Europe (97.7%, a difference of 0.010%), New Zealander (97.7%, a difference of 0.010%), Immigrants from North America (97.7%, a difference of 0.020%), and Kiowa (97.7%, a difference of 0.020%).
| Demographics | Rating | Rank | 6th Grade |
| Whites/Caucasians | 99.8 /100 | #57 | Exceptional 97.7% |
| Greeks | 99.8 /100 | #58 | Exceptional 97.7% |
| Americans | 99.8 /100 | #59 | Exceptional 97.7% |
| Immigrants | Canada | 99.8 /100 | #60 | Exceptional 97.7% |
| Serbians | 99.7 /100 | #61 | Exceptional 97.7% |
| Immigrants | North America | 99.7 /100 | #62 | Exceptional 97.7% |
| Russians | 99.7 /100 | #63 | Exceptional 97.7% |
| Canadians | 99.7 /100 | #64 | Exceptional 97.7% |
| Immigrants | Northern Europe | 99.6 /100 | #65 | Exceptional 97.7% |
| New Zealanders | 99.6 /100 | #66 | Exceptional 97.7% |
| Kiowa | 99.6 /100 | #67 | Exceptional 97.7% |
| Immigrants | Austria | 99.6 /100 | #68 | Exceptional 97.7% |
| Iranians | 99.6 /100 | #69 | Exceptional 97.6% |
| Cajuns | 99.5 /100 | #70 | Exceptional 97.6% |
| Chickasaw | 99.5 /100 | #71 | Exceptional 97.6% |
Demographics Similar to Sudanese by 6th Grade
In terms of 6th grade, the demographic groups most similar to Sudanese are Immigrants from Chile (96.8%, a difference of 0.0%), Immigrants from Bahamas (96.8%, a difference of 0.0%), African (96.9%, a difference of 0.010%), Immigrants from Zaire (96.9%, a difference of 0.010%), and Native/Alaskan (96.8%, a difference of 0.010%).
| Demographics | Rating | Rank | 6th Grade |
| Immigrants | Uganda | 21.2 /100 | #196 | Fair 96.9% |
| Brazilians | 20.1 /100 | #197 | Fair 96.9% |
| Immigrants | Albania | 18.8 /100 | #198 | Poor 96.9% |
| Immigrants | Northern Africa | 15.7 /100 | #199 | Poor 96.9% |
| Africans | 14.8 /100 | #200 | Poor 96.9% |
| Immigrants | Zaire | 14.5 /100 | #201 | Poor 96.9% |
| Immigrants | Chile | 14.2 /100 | #202 | Poor 96.8% |
| Sudanese | 13.9 /100 | #203 | Poor 96.8% |
| Immigrants | Bahamas | 13.8 /100 | #204 | Poor 96.8% |
| Natives/Alaskans | 13.0 /100 | #205 | Poor 96.8% |
| Laotians | 11.8 /100 | #206 | Poor 96.8% |
| Iraqis | 11.7 /100 | #207 | Poor 96.8% |
| Samoans | 11.0 /100 | #208 | Poor 96.8% |
| Immigrants | Oceania | 11.0 /100 | #209 | Poor 96.8% |
| Immigrants | Nepal | 10.1 /100 | #210 | Poor 96.8% |