South American Indian vs Sudanese 10th Grade
COMPARE
South American Indian
Sudanese
10th Grade
10th Grade Comparison
South American Indians
Sudanese
93.1%
10TH GRADE
4.9/ 100
METRIC RATING
231st/ 347
METRIC RANK
93.6%
10TH GRADE
36.6/ 100
METRIC RATING
185th/ 347
METRIC RANK
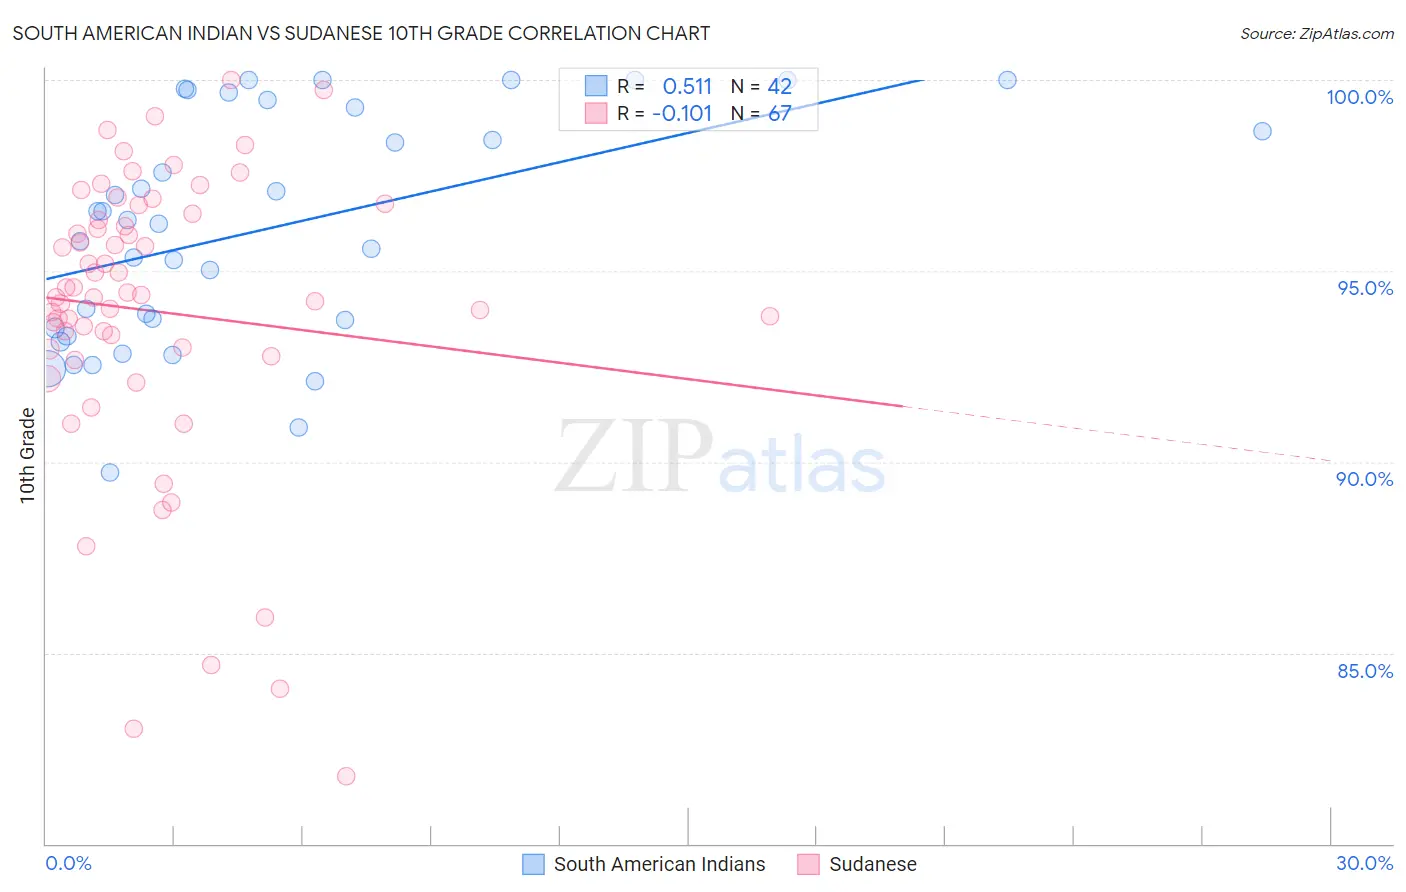
South American Indian vs Sudanese 10th Grade Correlation Chart
The statistical analysis conducted on geographies consisting of 164,571,317 people shows a substantial positive correlation between the proportion of South American Indians and percentage of population with at least 10th grade education in the United States with a correlation coefficient (R) of 0.511 and weighted average of 93.1%. Similarly, the statistical analysis conducted on geographies consisting of 110,134,719 people shows a poor negative correlation between the proportion of Sudanese and percentage of population with at least 10th grade education in the United States with a correlation coefficient (R) of -0.101 and weighted average of 93.6%, a difference of 0.55%.
10th Grade Correlation Summary
| Measurement | South American Indian | Sudanese |
| Minimum | 89.7% | 81.8% |
| Maximum | 100.0% | 100.0% |
| Range | 10.3% | 18.2% |
| Mean | 96.1% | 93.9% |
| Median | 96.3% | 94.4% |
| Interquartile 25% (IQ1) | 93.5% | 93.0% |
| Interquartile 75% (IQ3) | 99.3% | 96.5% |
| Interquartile Range (IQR) | 5.8% | 3.5% |
| Standard Deviation (Sample) | 3.0% | 3.8% |
| Standard Deviation (Population) | 2.9% | 3.8% |
Similar Demographics by 10th Grade
Demographics Similar to South American Indians by 10th Grade
In terms of 10th grade, the demographic groups most similar to South American Indians are Bahamian (93.1%, a difference of 0.0%), Comanche (93.1%, a difference of 0.0%), Immigrants from Ethiopia (93.1%, a difference of 0.010%), Immigrants from Africa (93.1%, a difference of 0.010%), and Subsaharan African (93.1%, a difference of 0.010%).
| Demographics | Rating | Rank | 10th Grade |
| Bolivians | 6.7 /100 | #224 | Tragic 93.2% |
| Somalis | 6.2 /100 | #225 | Tragic 93.2% |
| Koreans | 6.1 /100 | #226 | Tragic 93.2% |
| Blacks/African Americans | 6.0 /100 | #227 | Tragic 93.2% |
| Immigrants | China | 5.9 /100 | #228 | Tragic 93.2% |
| Immigrants | Ethiopia | 5.1 /100 | #229 | Tragic 93.1% |
| Immigrants | Africa | 5.0 /100 | #230 | Tragic 93.1% |
| South American Indians | 4.9 /100 | #231 | Tragic 93.1% |
| Bahamians | 4.9 /100 | #232 | Tragic 93.1% |
| Comanche | 4.9 /100 | #233 | Tragic 93.1% |
| Sub-Saharan Africans | 4.7 /100 | #234 | Tragic 93.1% |
| Africans | 4.6 /100 | #235 | Tragic 93.1% |
| Afghans | 4.5 /100 | #236 | Tragic 93.1% |
| Immigrants | Panama | 4.3 /100 | #237 | Tragic 93.1% |
| Nigerians | 4.2 /100 | #238 | Tragic 93.1% |
Demographics Similar to Sudanese by 10th Grade
In terms of 10th grade, the demographic groups most similar to Sudanese are Guamanian/Chamorro (93.6%, a difference of 0.0%), Choctaw (93.6%, a difference of 0.0%), Immigrants from Eastern Asia (93.6%, a difference of 0.010%), Colville (93.6%, a difference of 0.020%), and Liberian (93.6%, a difference of 0.020%).
| Demographics | Rating | Rank | 10th Grade |
| Sierra Leoneans | 46.1 /100 | #178 | Average 93.7% |
| Paraguayans | 45.3 /100 | #179 | Average 93.7% |
| Blackfeet | 42.8 /100 | #180 | Average 93.7% |
| Immigrants | Northern Africa | 41.6 /100 | #181 | Average 93.7% |
| Colville | 38.8 /100 | #182 | Fair 93.6% |
| Guamanians/Chamorros | 37.1 /100 | #183 | Fair 93.6% |
| Choctaw | 36.6 /100 | #184 | Fair 93.6% |
| Sudanese | 36.6 /100 | #185 | Fair 93.6% |
| Immigrants | Eastern Asia | 35.1 /100 | #186 | Fair 93.6% |
| Liberians | 34.7 /100 | #187 | Fair 93.6% |
| Marshallese | 33.2 /100 | #188 | Fair 93.6% |
| Immigrants | Pakistan | 32.5 /100 | #189 | Fair 93.6% |
| Laotians | 32.1 /100 | #190 | Fair 93.6% |
| Yup'ik | 31.1 /100 | #191 | Fair 93.6% |
| Immigrants | Malaysia | 28.0 /100 | #192 | Fair 93.5% |